VCIX-NV Objective 5.2 – Troubleshoot Common NSX Component Issues
This post is part of my VMware VCIX-NV Study Guide and covers some troubleshooting tips for common NSX component issues.
Documentation
Index
- Troubleshoot NSX Manager services
- Troubleshoot NSX Controller cluster status, roles and connectivity
- Troubleshoot active NSX Controller connections
- Troubleshoot Logical Switch transport zone and NSX Edge mappings
- Troubleshoot Logical Router interface and route mappings
- Troubleshoot VXLAN and Logical Router mapping tables
- Troubleshoot L2 Bridge learned MAC addresses
- Troubleshoot distributed and edge firewall implementations
Service Composer
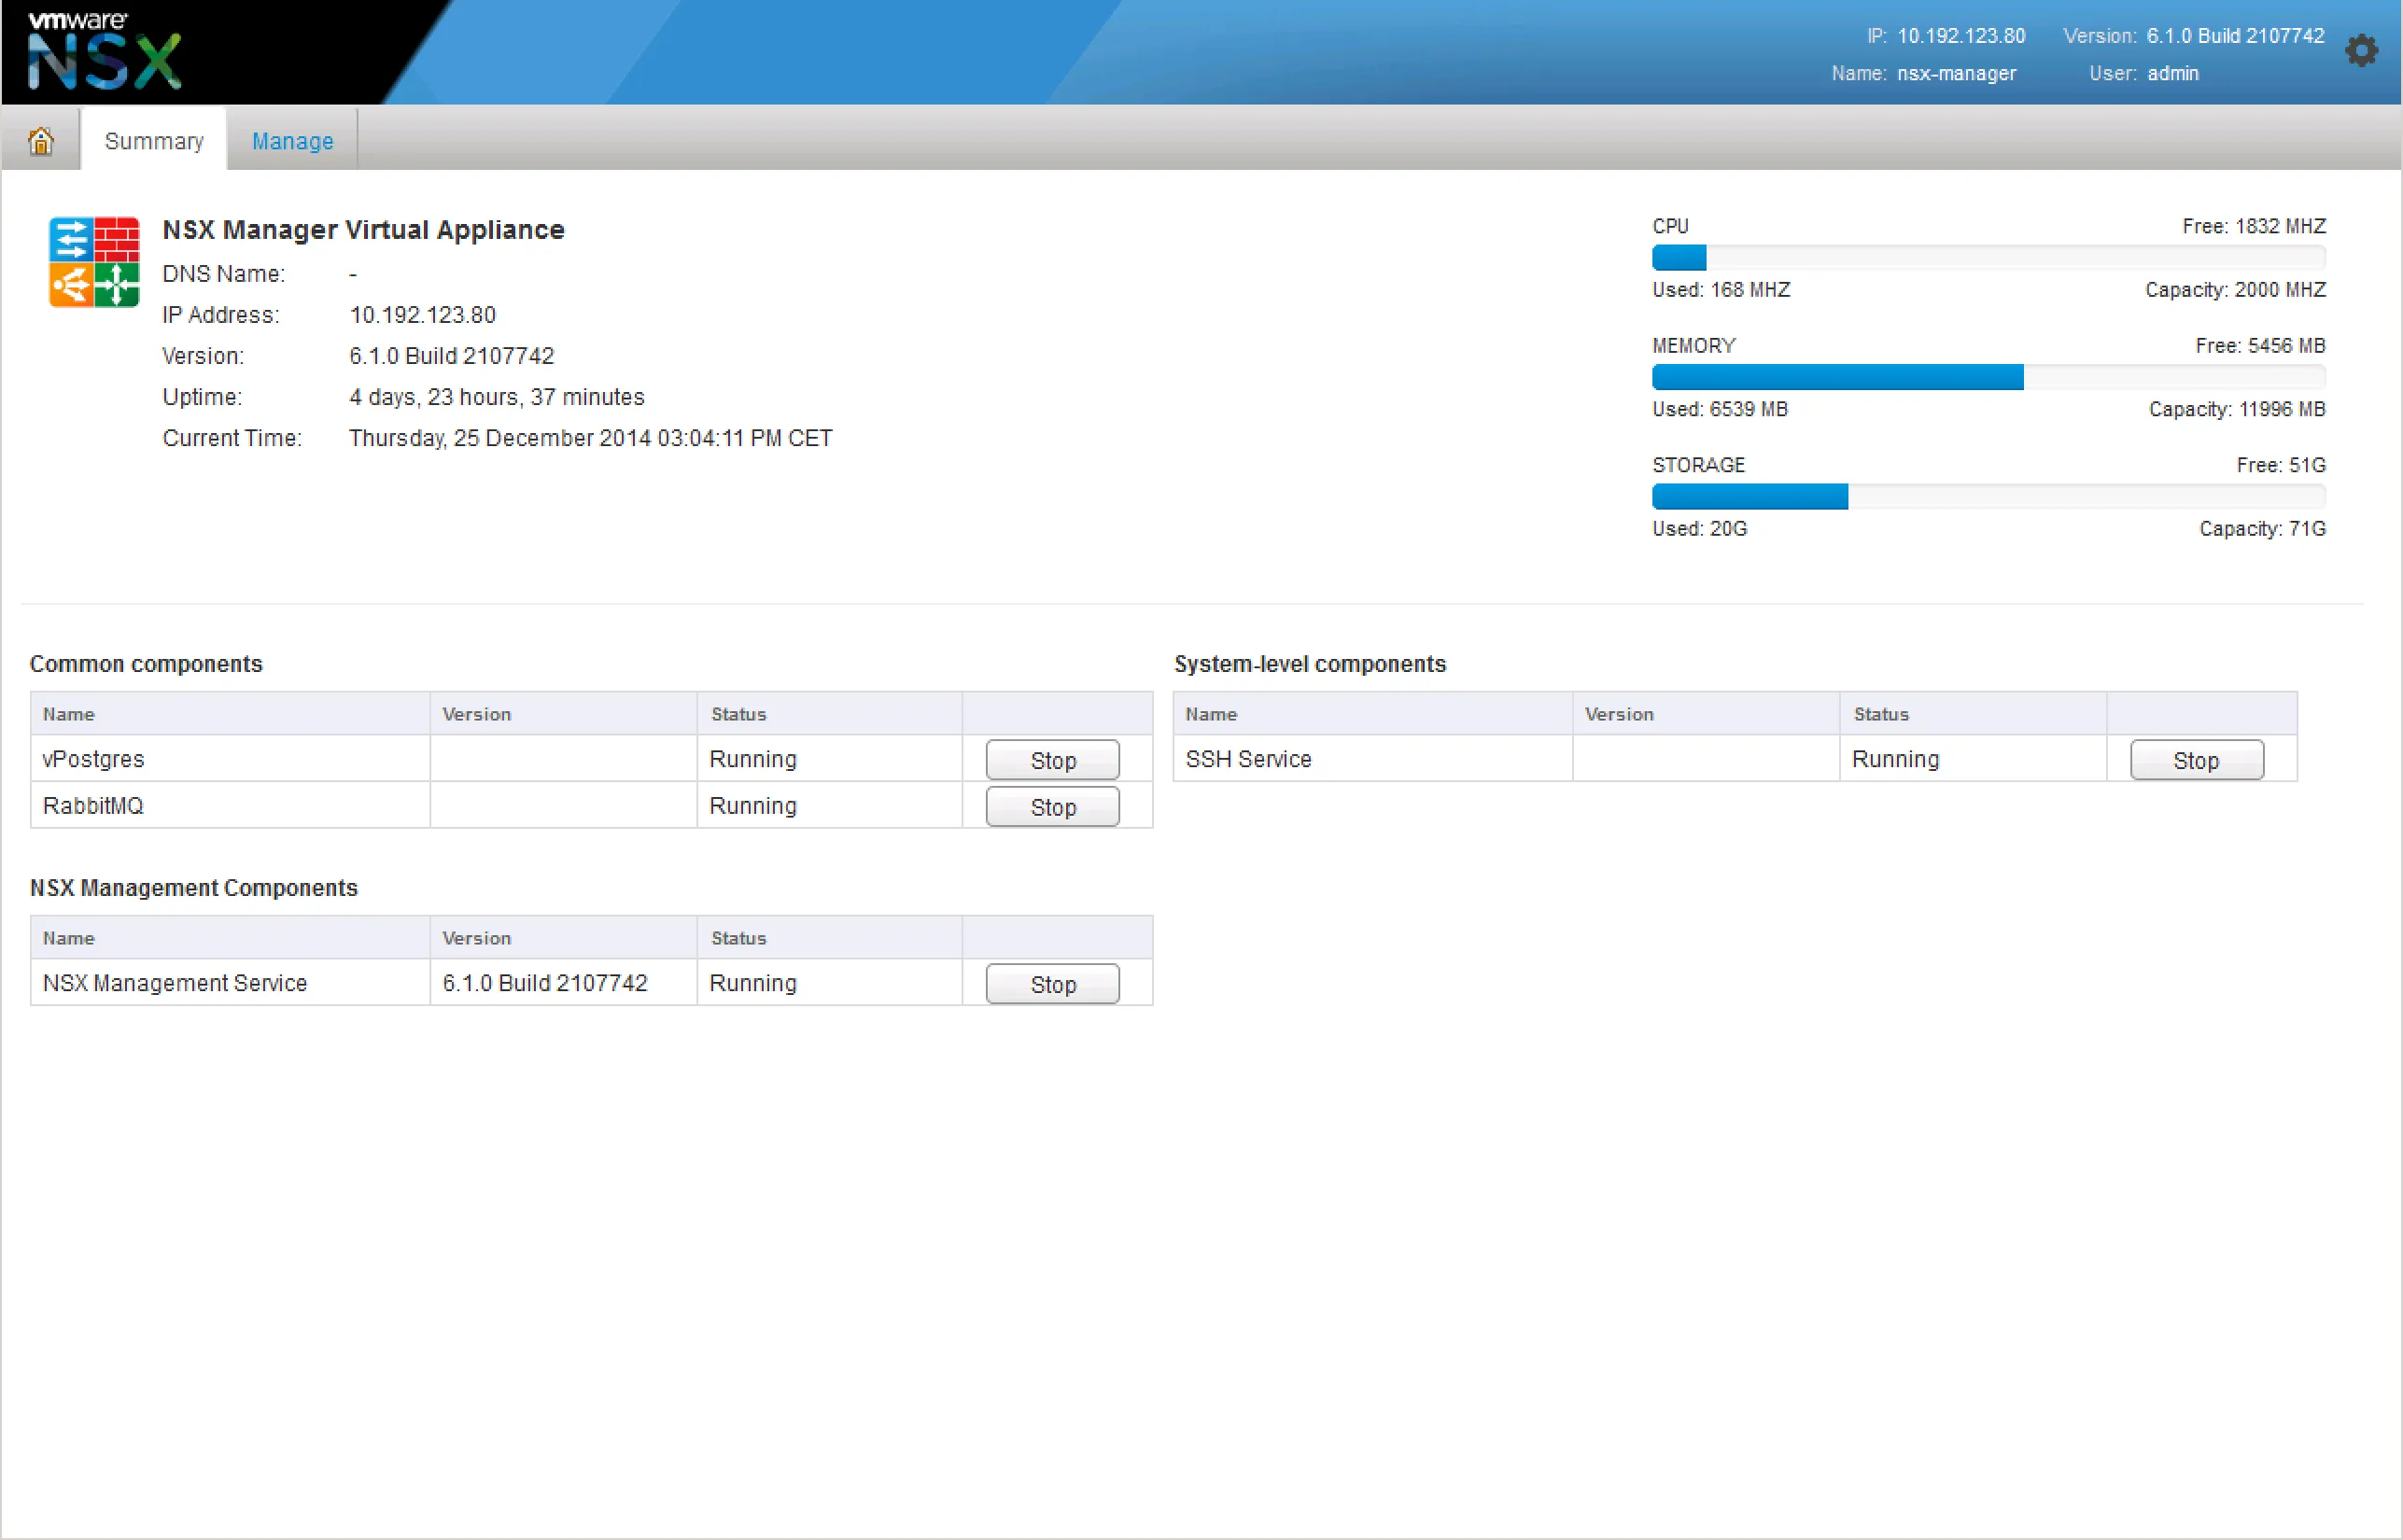
Troubleshoot NSX Manager services
If you’re having trouble with provisioning NSX services, it’d be wise to check the NSX Manager and it’s services. Login to your NSX Manager to check the status page:
If that looks good and the NSX Manager is still giving you issues, start the SSH service and login via SSH. There’s a few things you can check.
Check the filesystem usage: 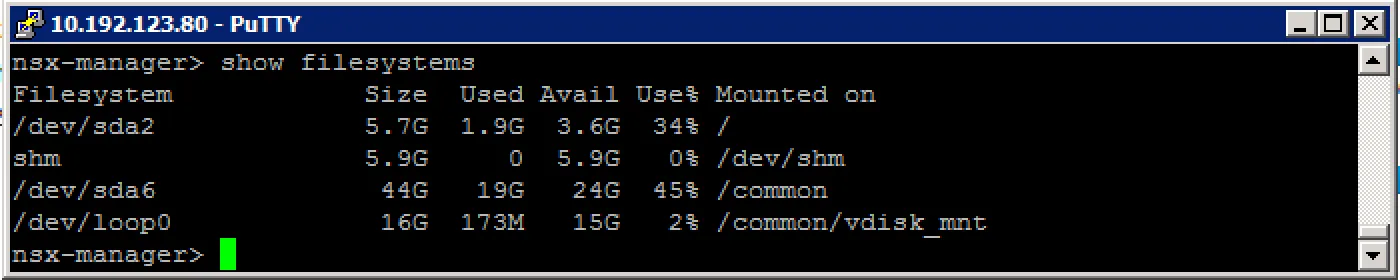
Check the event log: 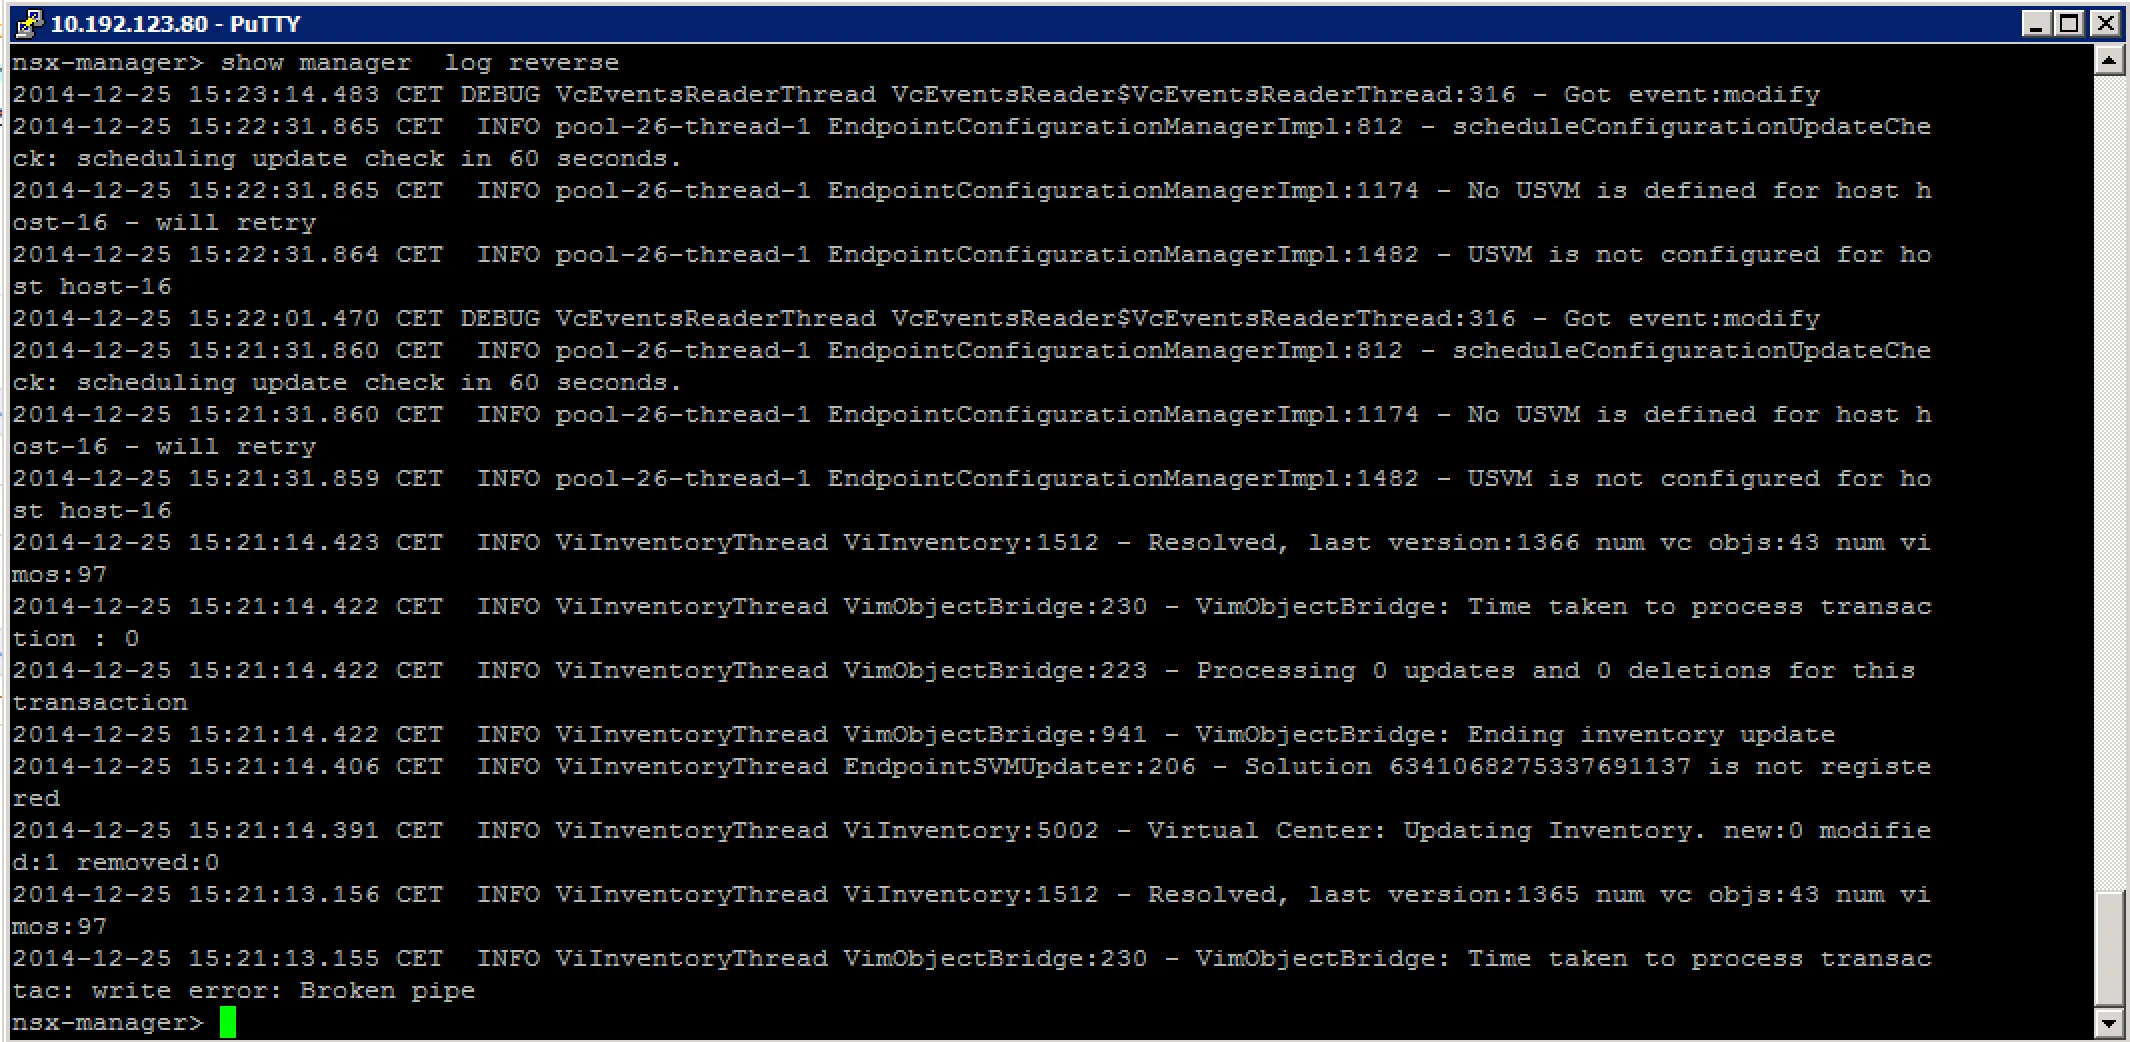
Check for rogue processes: 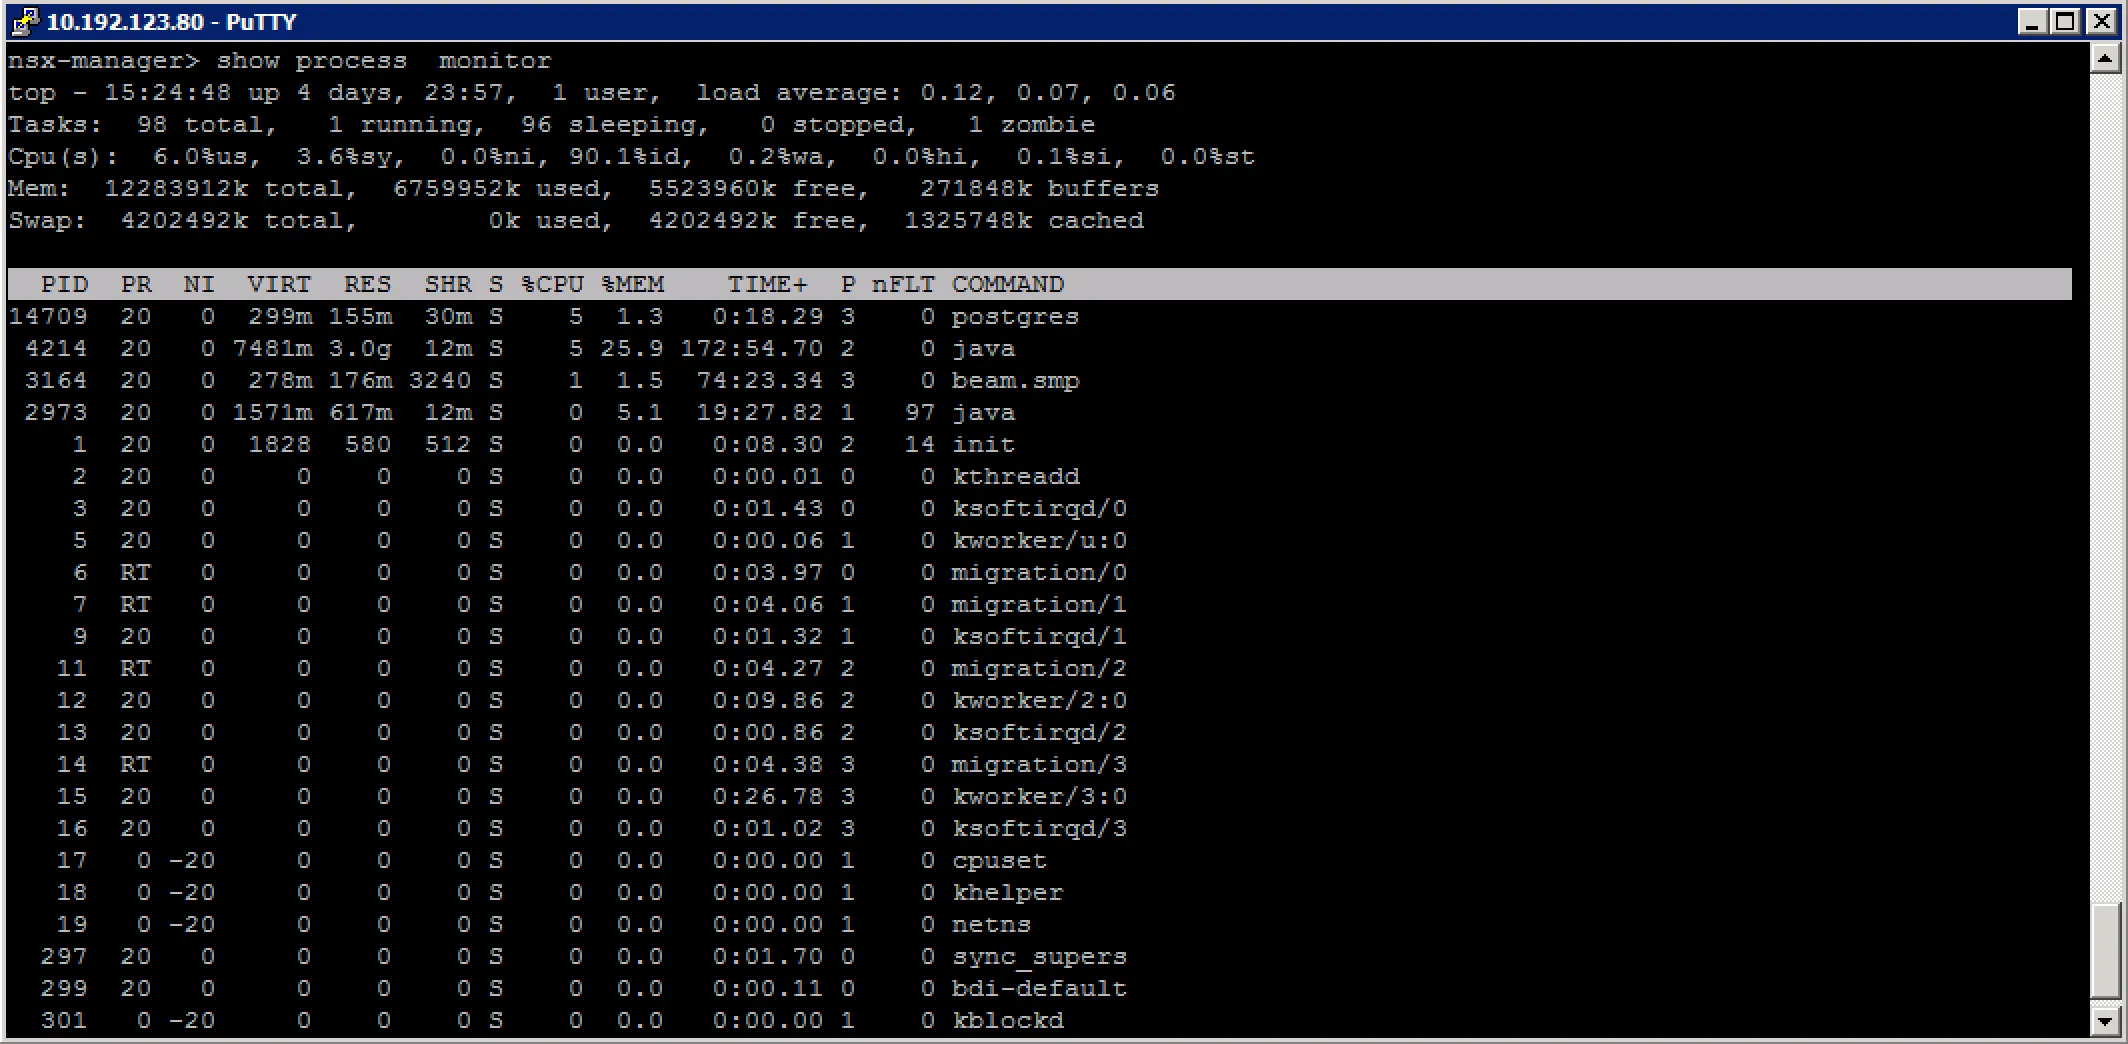
Troubleshoot NSX Controller cluster status, roles and connectivity
VMware Documentation: Set Up the Control Plane
The NSX controller is the control plane of your virtual network. It stores all the metadata of the network components, without the controllers, there would be no network. Usually, NSX controllers are deployed in a 3-or-more fashion for redundancy. As they are virtual machines, things can happen that could result into controller failures, possibly corruptions. Below are a few examples of troubleshooting NSX controller issues.
Checking controller status in vCenter First thing to check with a controller issue is to check the overall status in the vCenter interface. Browse to “Networking & Security” - “Installation” - and check the “Management” tab. The “NSX Controller nodes” table contains a per controller status overview.
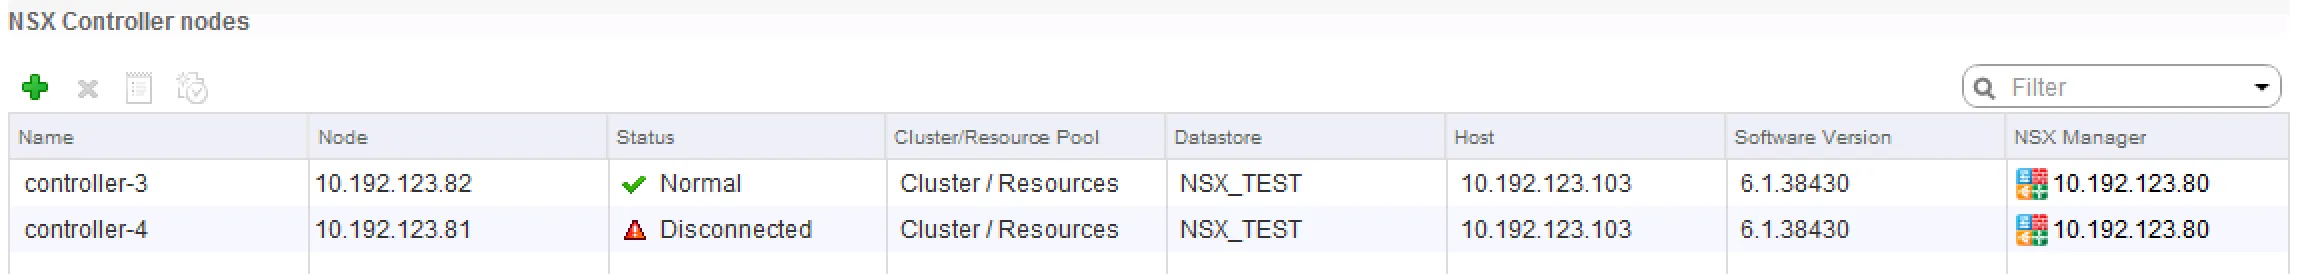 Note: 2 NSX controllers are not recommended, this is a test lab.
Checking controller cluster status via command-line After verifying the controller status, we move on to the controller cluster status. Login to the NSX controller of choice with SSH and execute the following commands:
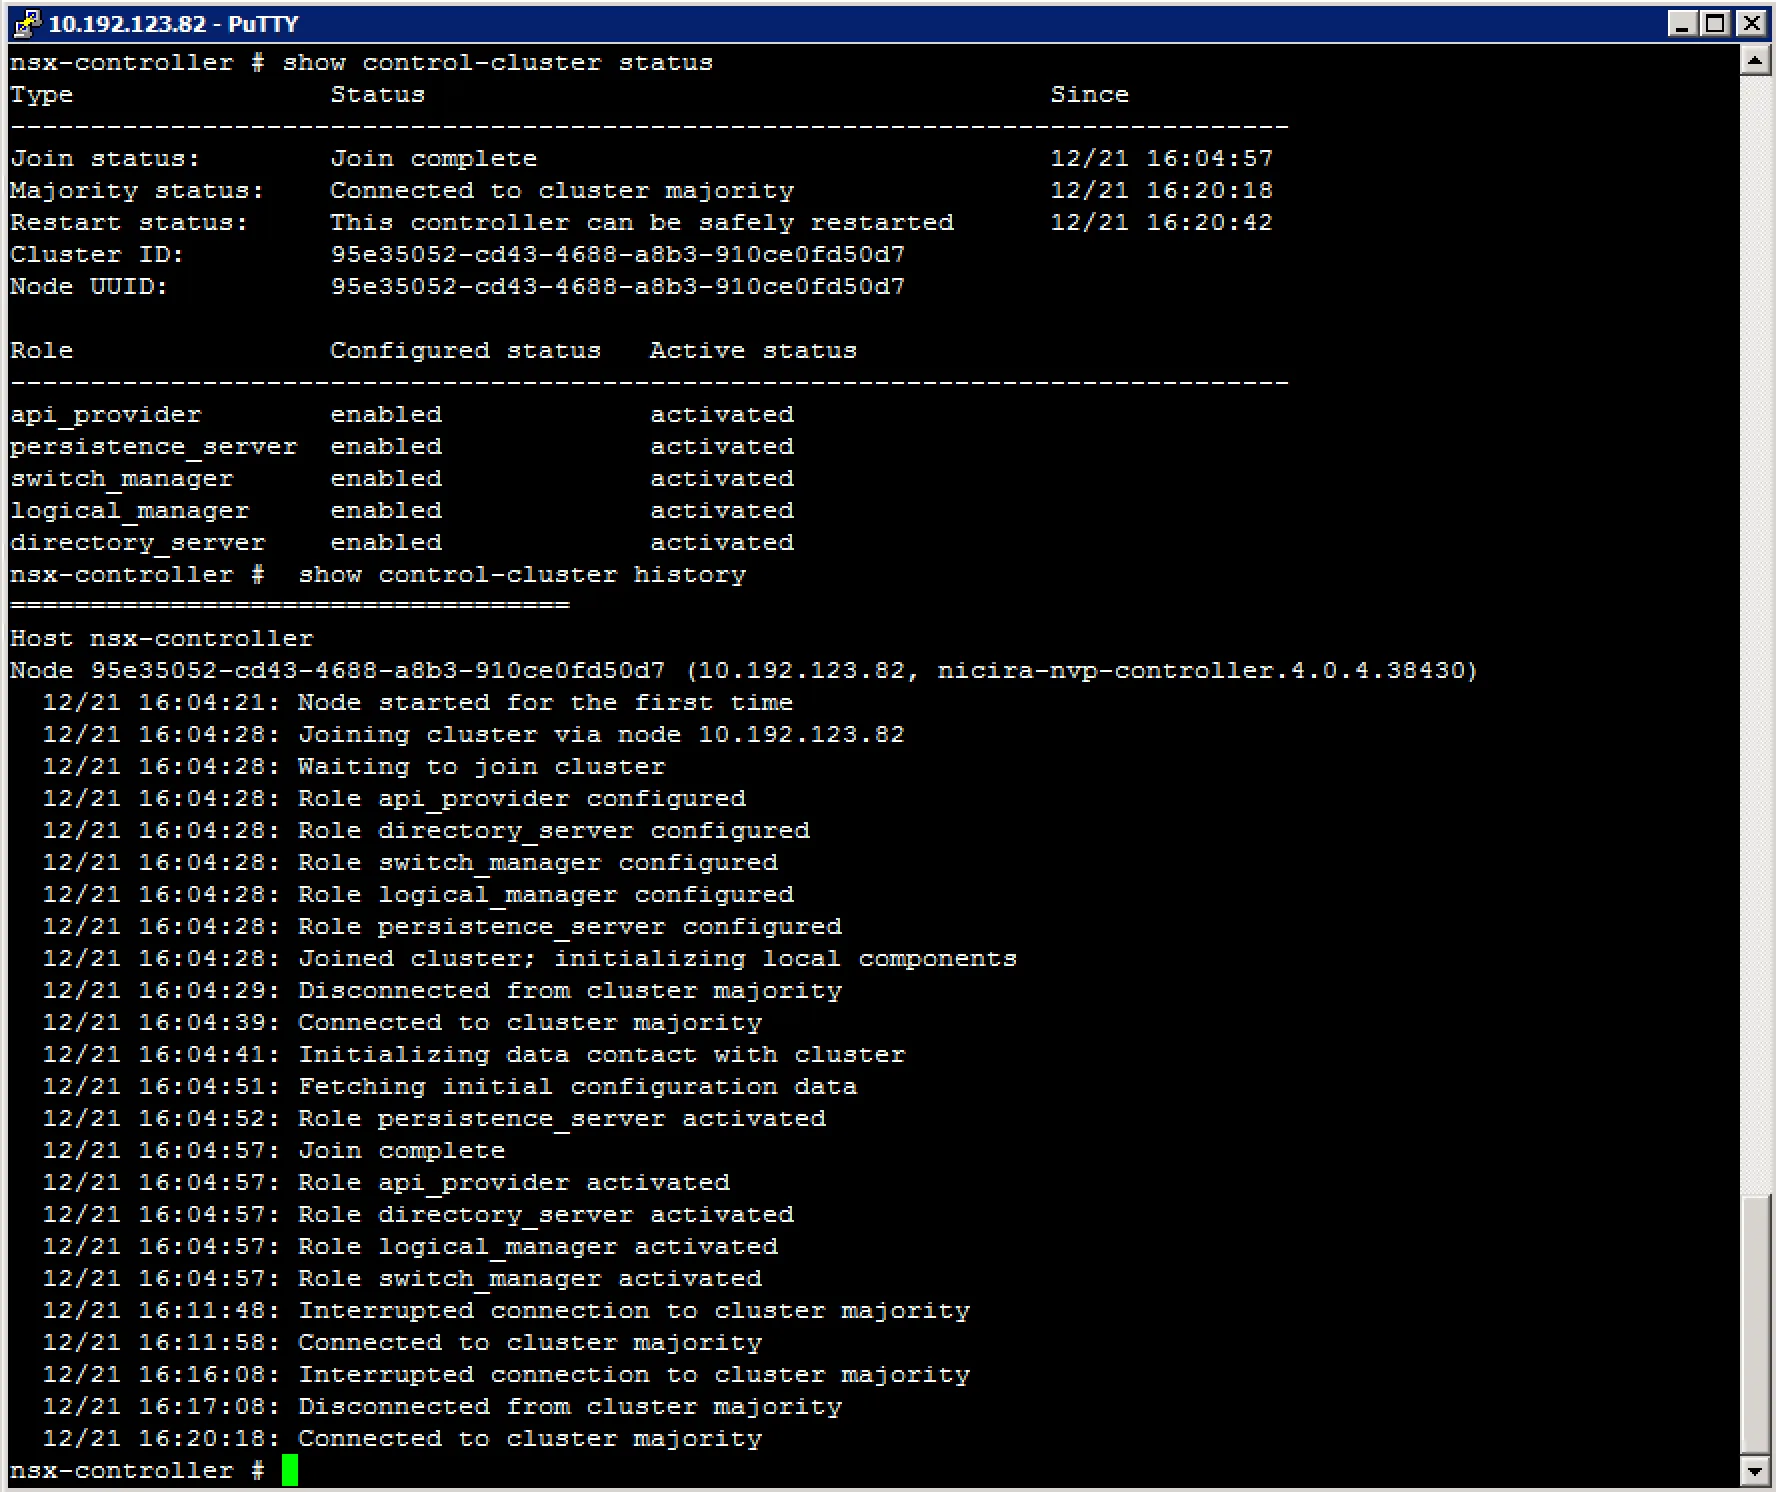
The “Join status” and “Majority status” should reflect a connected status.
Recovering a failure controller node When a controller becomes corrupt and when it is no longer part of the cluster, you can do two things. One is to just delete the controller and deploy a new one, the other is to repair the controller. The last one is more fun, so lets dig in.
Repairing a controller usually means to resynchronise its configuration and data to the existing cluster. To do this, we need the majority leader of the cluster. Finding the majority leader is not something you can do in the vCenter GUI and needs to be done in the CLI. Login to your controllers and execute this command:
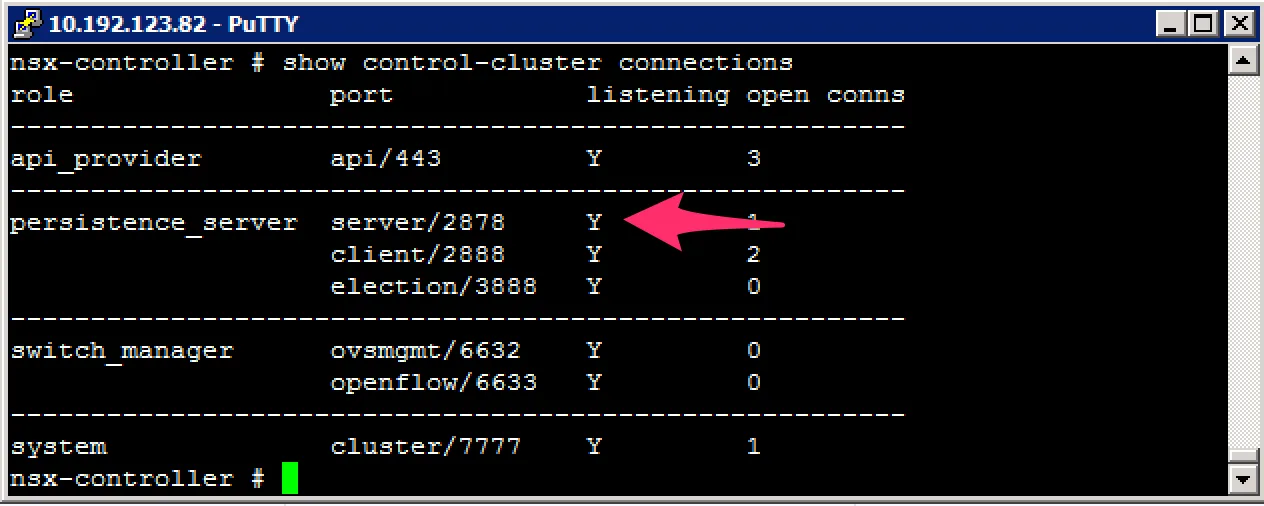
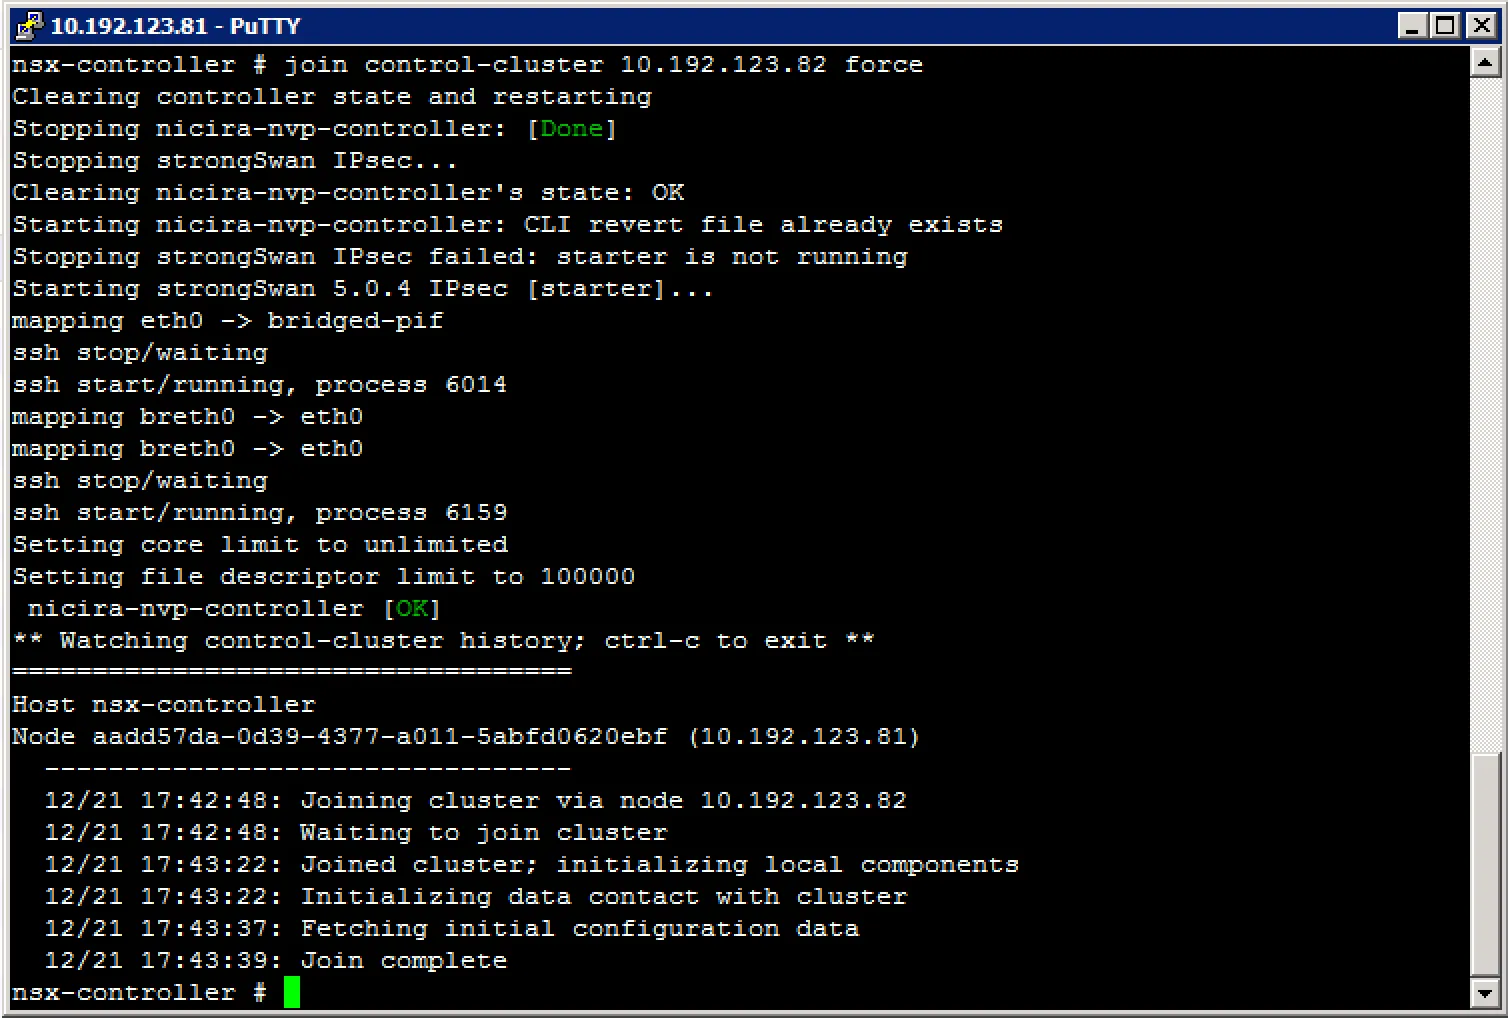
You’re looking for the “persistence_server” listening on port 2878. The majority leader will be listening on this port. After finding the majority leader, you can forcibly resynchronise the broken controller to the cluster with this command:
Troubleshoot active NSX Controller connections
With troubleshooting active NSX Controller connections, I’m assuming to make them visible. Below are a few commands to get some insight into the open connections of a controller.
show control-cluster connections (show active cluster connections)
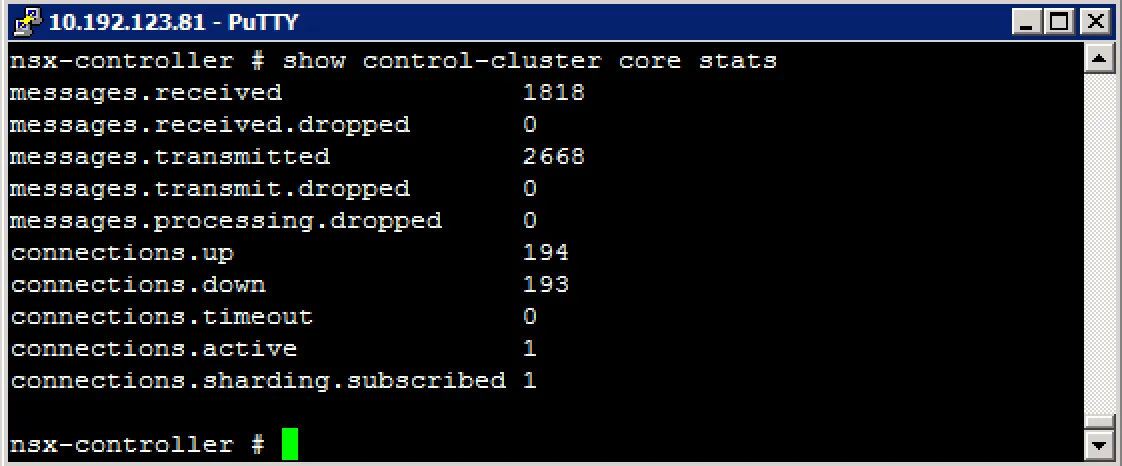
show control-cluster core stats (show cluster connections current, received, transmitted)
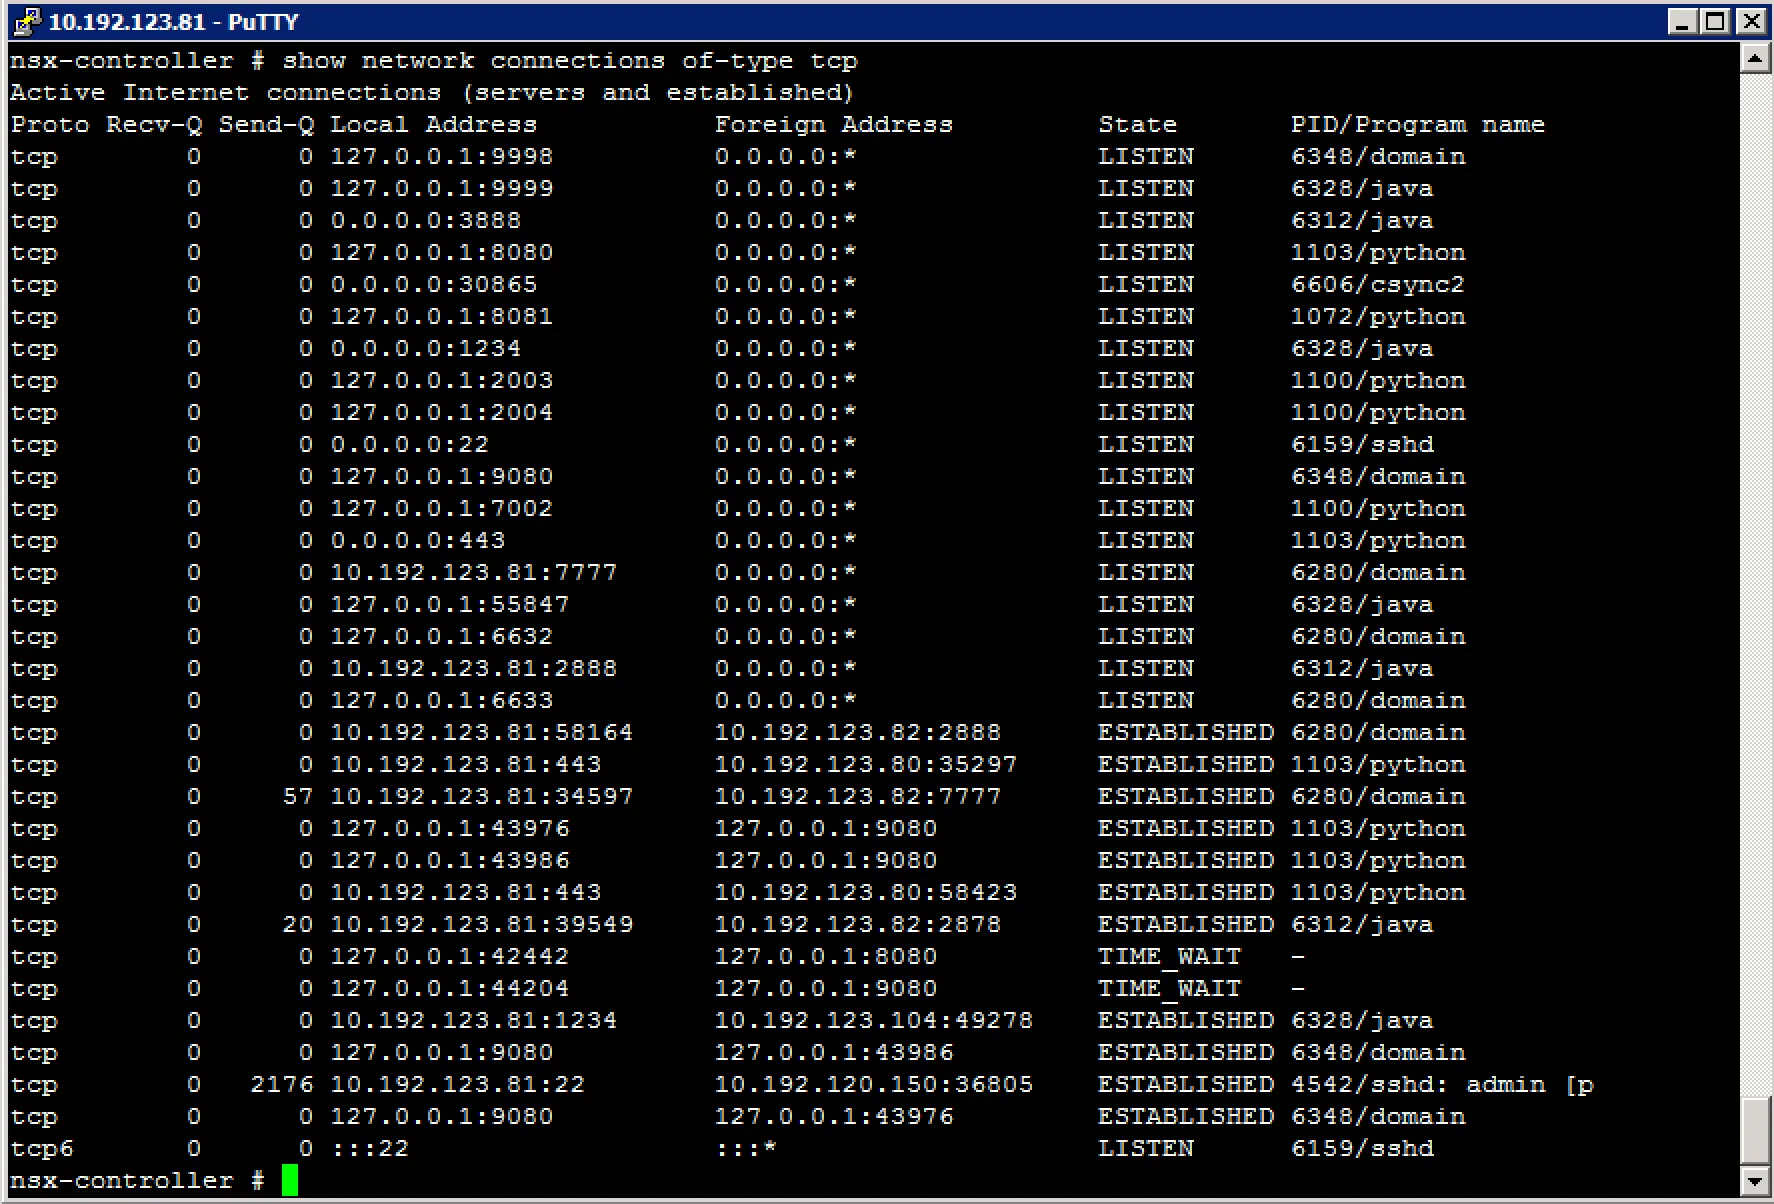
show network connections of-type tcp (show active TCP connections)
Troubleshoot Logical Switch transport zone and NSX Edge mappings
Troubleshoot Logical Router interface and route mappings
Troubleshoot VXLAN and Logical Router mapping tables
To get an overview of the NSX Edge instance interface and routes mappings, you can use the information stored inside the NSX controllers. Login to a controller via SSH and have a look at the output of the following commands:
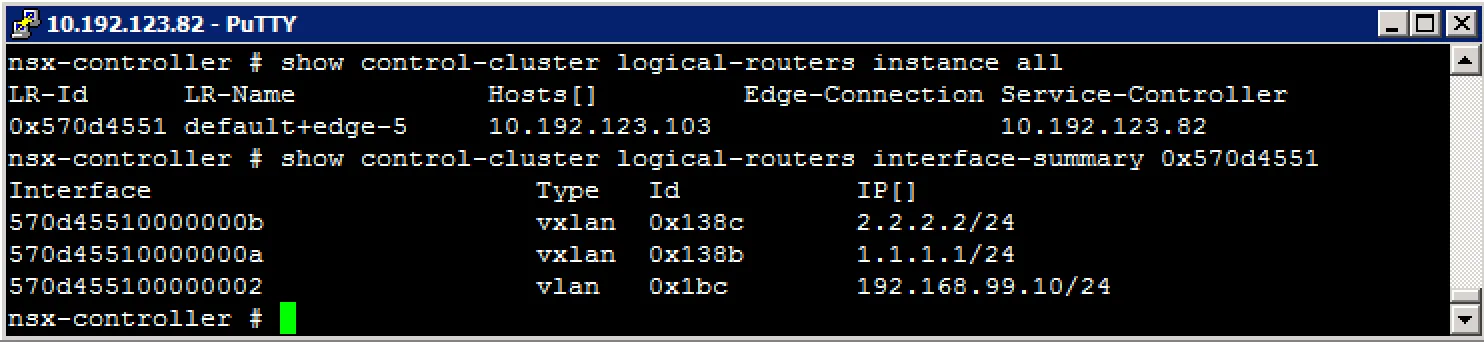
Get all logical router instances show control-cluster logical-routers instance all
Get logical router interfaces show control-cluster logical-routers interface-summary
Get logical router installed routers show control-cluster logical-routers routes
Example output:
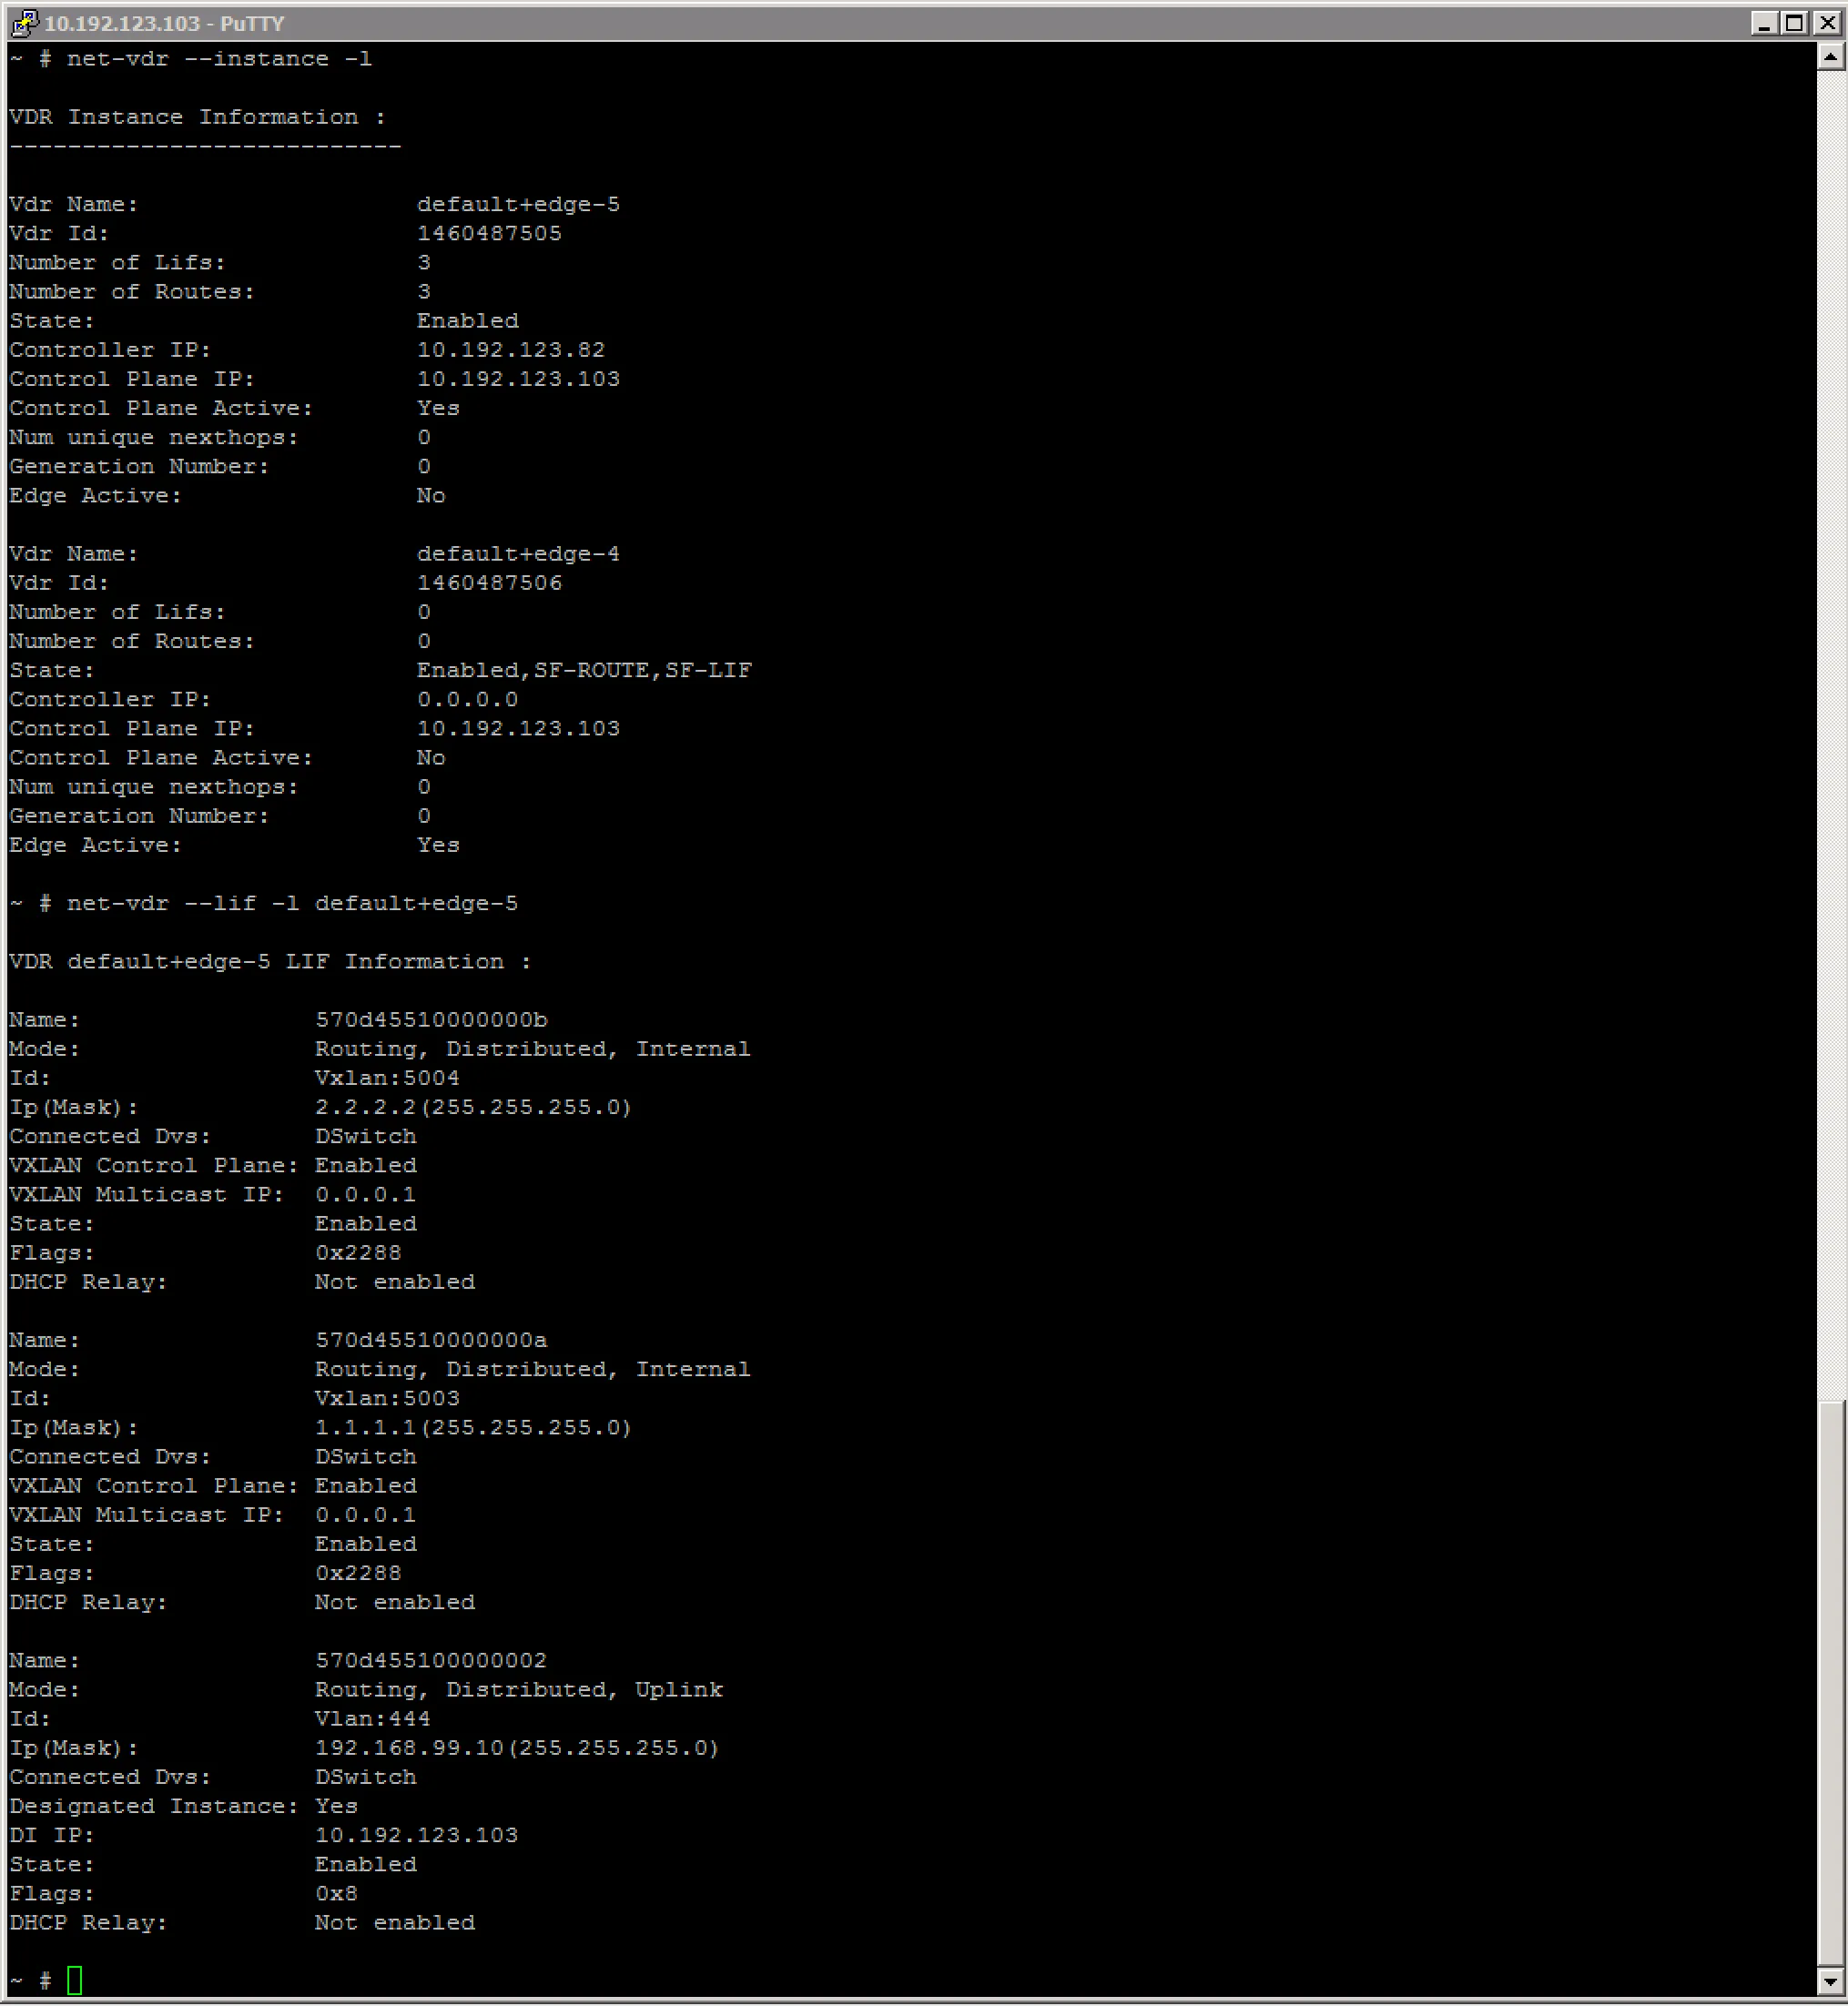
You can also display this information from the ESXi node hosting the logical router, with the net-vdr command:
Getting Transport Zone (VXLAN backend) information can help you troubleshoot connectivity issues. Useful information is usually located on the ESXi node.
# esxcli network vswitch dvs vmware vxlan network mac --vds-name <distributed vswitch> --vxlan-id <VXLAN id>
IP                  Segment ID        Is MTEP
192.168.99.104    192.168.99.0        False
To get a lot more information, check this awesome post by William Lam.
Troubleshoot L2 Bridge learned MAC addresses
The Logical Distributed Router can bridge VXLAN and VLANs. The control VM of the LDR executes this bridging and learn the physical mac addresses. Login to the ESXi node hosting the LDR Control VM, lookup the LDR name with a previous mentioned command and execute the following commands to get an overview of MAC addresses learned on the bridge.
First, lets have a look at the general information about the bridge:
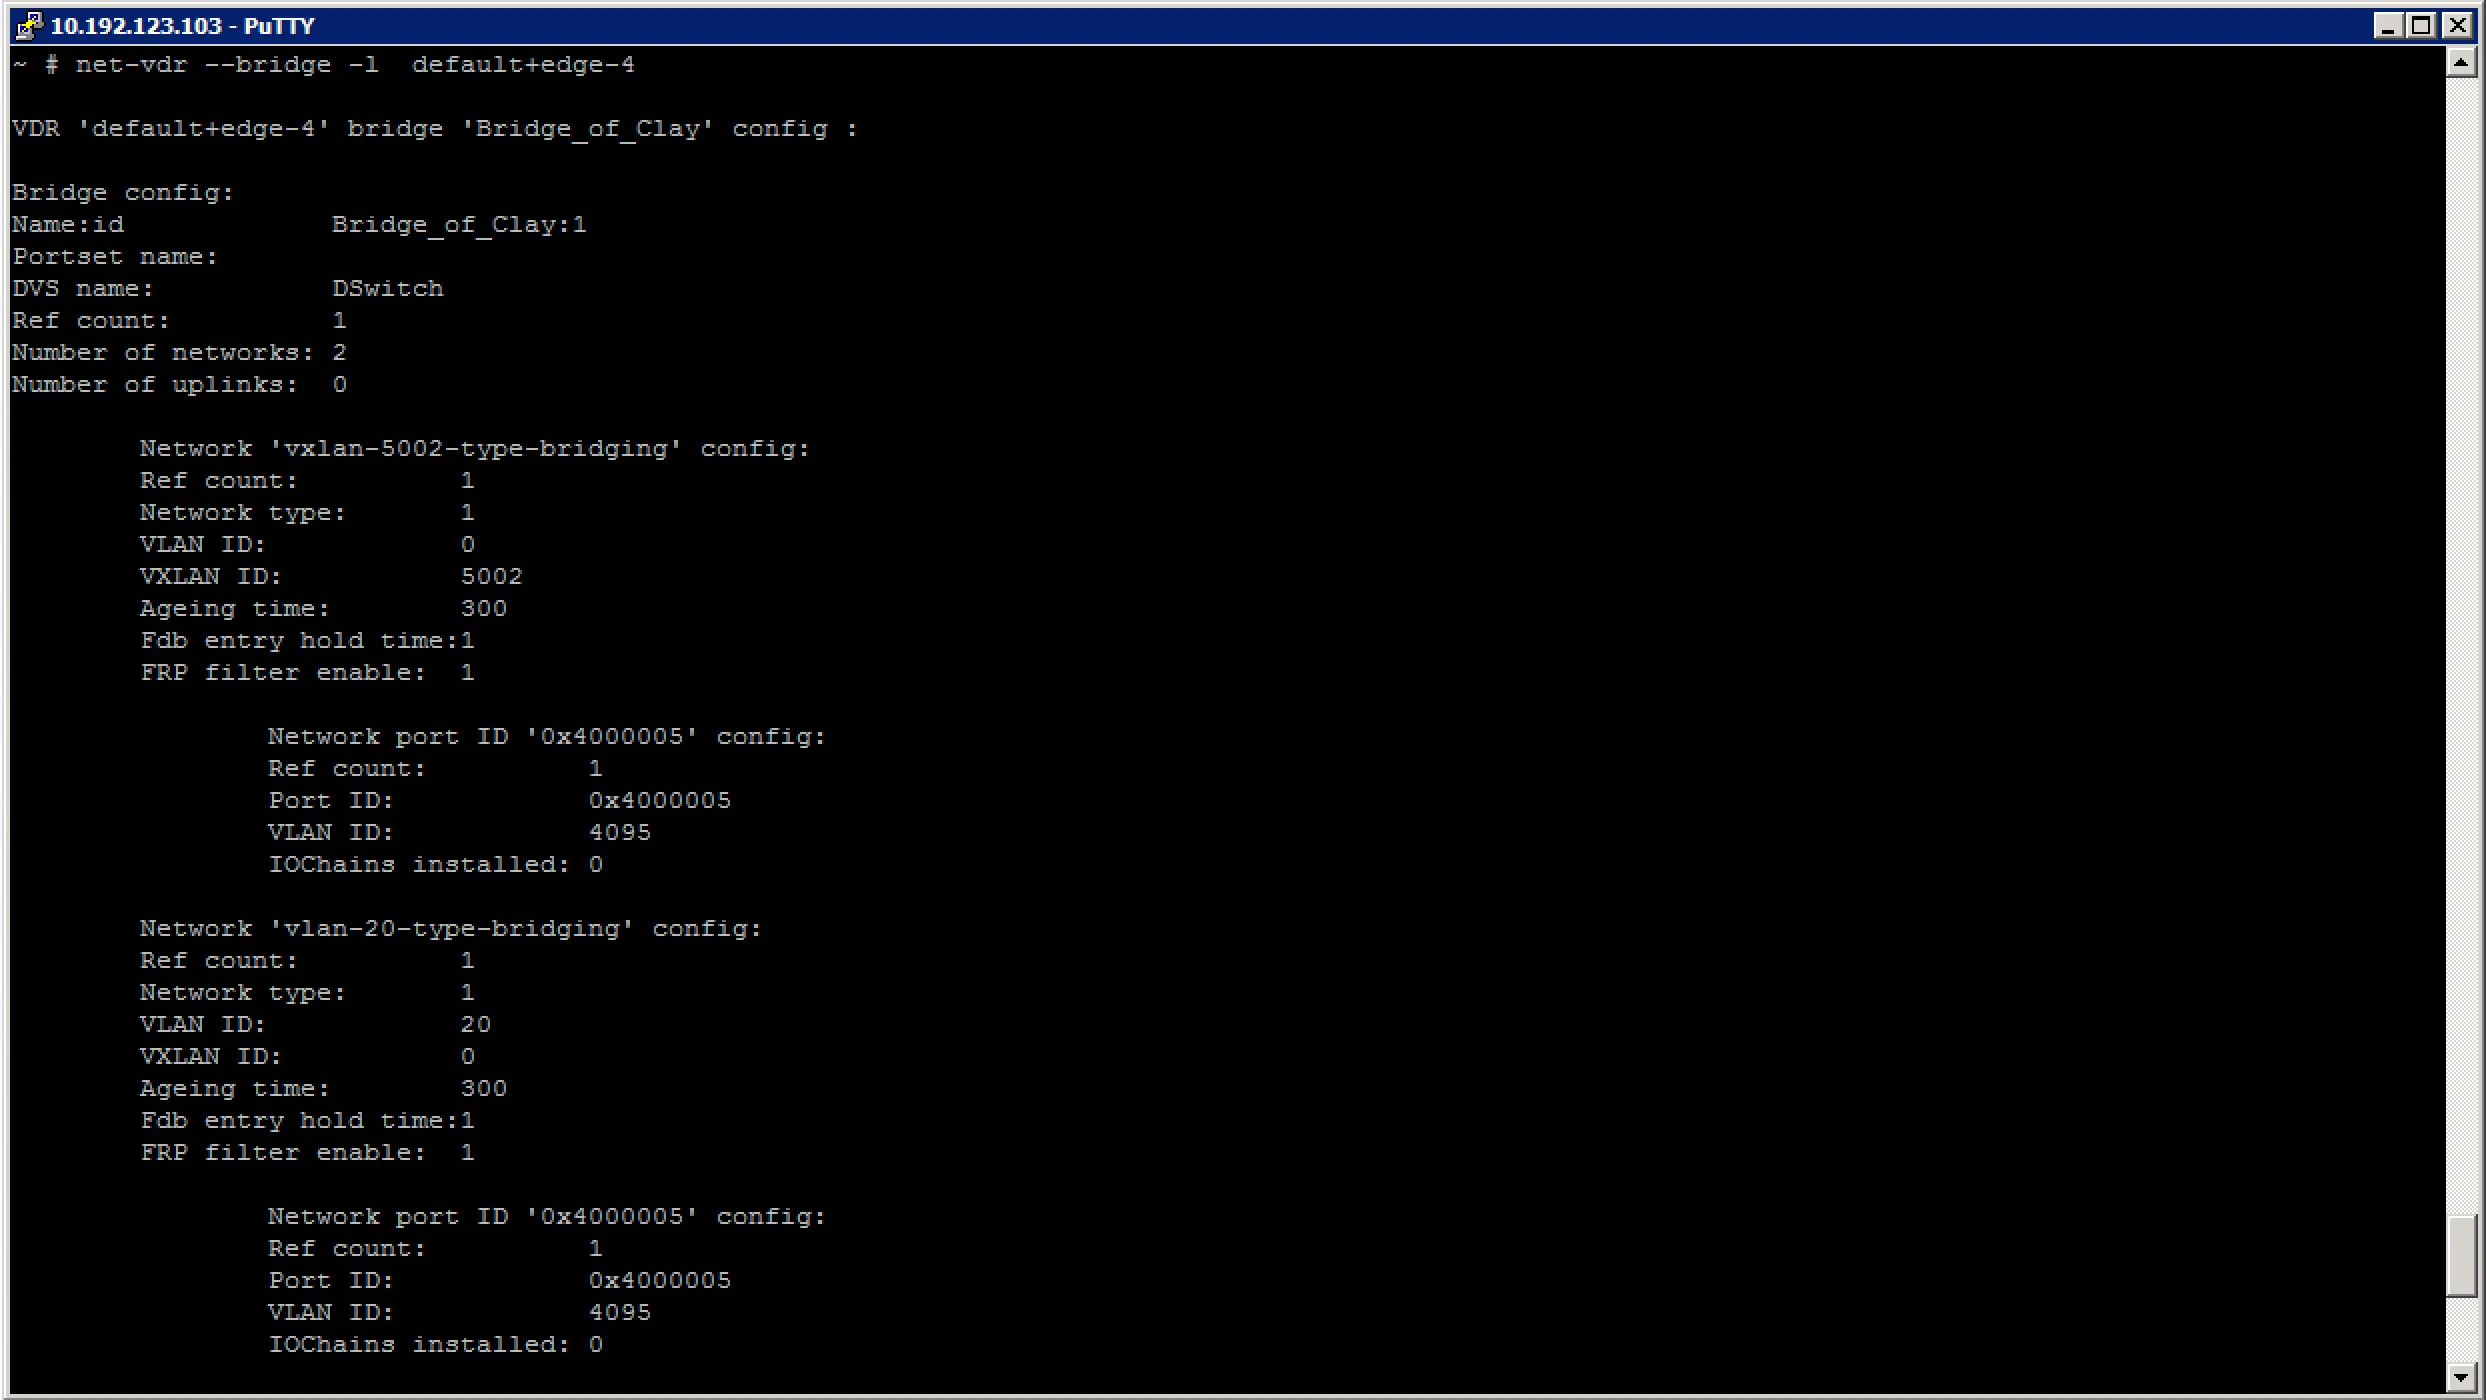
After which we can look at the mac address table for the different networks the bridge is attached to:
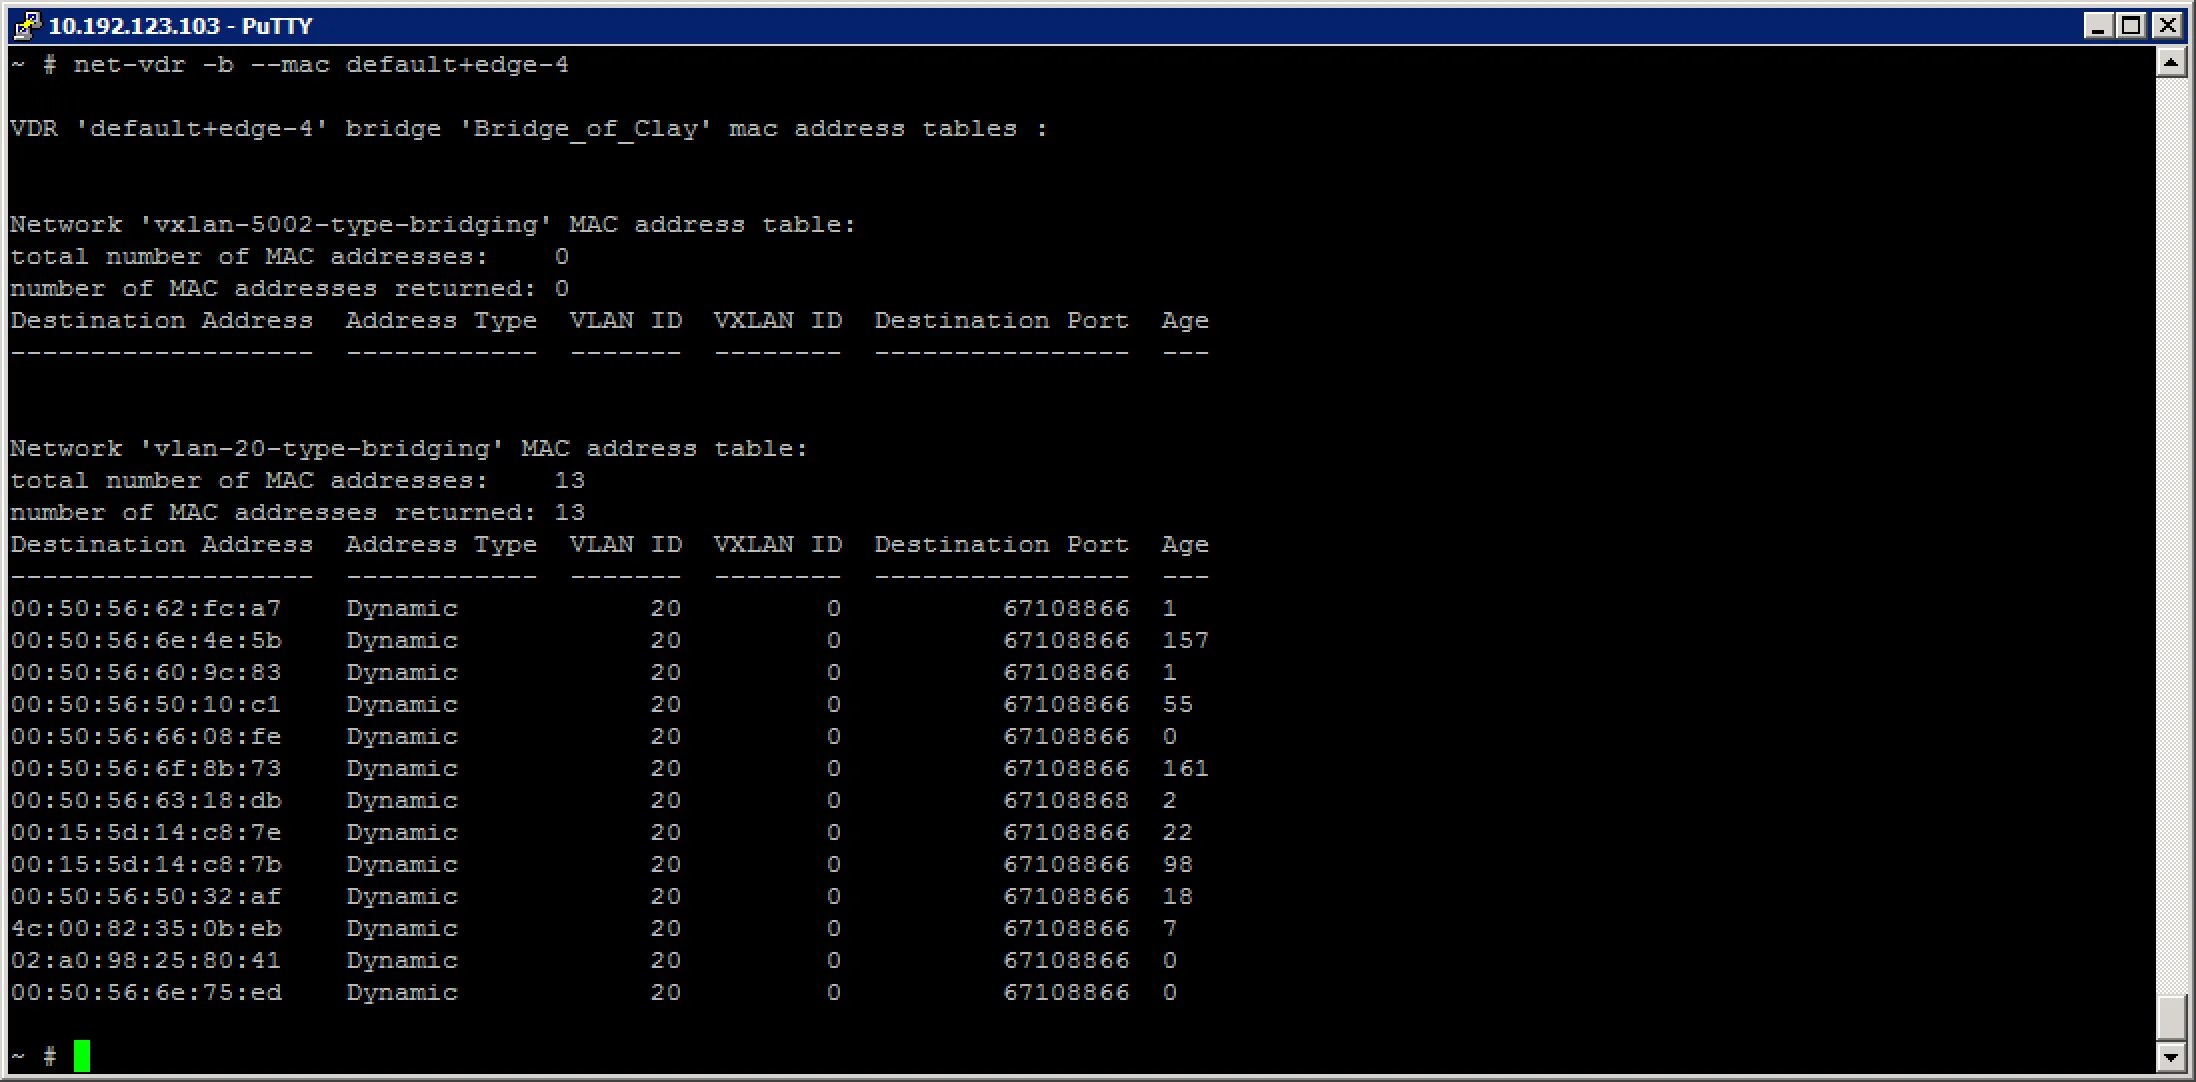
As you can see, the VXLAN network does not have any hosts on it, but the VLAN network does have quite a few hosts on it.
Troubleshoot distributed and edge firewall implementations
The Distributed Firewall is inside the ESXi kernel, so the ESXi node knows about what policies are configured on the virtual machines the ESXi node hosts. You can learn about the policies set on a VM through the commandline of ESXi.
First, we need to find the UUID of the virtual machine called App01:
~ # summarize-dvfilter | grep App01
world 1764245 vmm0:App01 vcUuid:'50 03 e7 19 22 48 f7 64-41 9a c8 4b 6f 75 31 69'
Then we look for the filter name for that virtual machine UUID:
~ # vsipioctl getfilters

Filter Name              : nic-1764245-eth1-vmware-sfw.2
VM UUID                  : 50 03 e7 19 22 48 f7 64-41 9a c8 4b 6f 75 31 69
VNIC Index               : 1
Service Profile          : --NOT SET--

Filter Name              : nic-1764245-eth0-vmware-sfw.2
VM UUID                  : 50 03 e7 19 22 48 f7 64-41 9a c8 4b 6f 75 31 69
VNIC Index               : 0
Service Profile          : --NOT SET--
As you might notice, this App01 virtual machine has two vNICs. That is why it has two policies attached to it.
After getting the filter name, you can look up the rules for that filter:
~ # vsipioctl getrules -f nic-1764245-eth0-vmware-sfw.2
ruleset domain-c7 {
  # Filter rules
  rule 1011 at 1 inout protocol any from addrset ip-securitygroup-15 to any drop;
  rule 1006 at 2 inout protocol any from addrset ip-securitygroup-15 to any drop;
  rule 1010 at 3 inout protocol tcp from addrset ip-securitygroup-12 to addrset ip-securitygroup-13 port 5672 accept;
  rule 1009 at 4 inout protocol tcp from addrset src1009 to addrset ip-securitygroup-14 port 3306 accept;
  rule 1008 at 5 inout protocol tcp from any to addrset ip-securitygroup-12 port 443 accept with log;
  rule 1008 at 6 inout protocol tcp from any to addrset ip-securitygroup-12 port 80 accept with log;
  rule 1008 at 7 inout protocol tcp from any to addrset ip-securitygroup-12 port 1234 accept with log;
  rule 1004 at 8 inout protocol ipv6-icmp icmptype 135 from any to any accept;
  rule 1004 at 9 inout protocol ipv6-icmp icmptype 136 from any to any accept;
  rule 1007 at 10 inout protocol any from any to any accept;
  rule 1003 at 11 inout protocol udp from any to any port 67 accept;
  rule 1003 at 12 inout protocol udp from any to any port 68 accept;
  rule 1002 at 13 inout protocol any from any to any accept;
}

ruleset domain-c7_L2 {
  # Filter rules
  rule 1001 at 1 inout ethertype any from any to any accept;
}

~ #
You can also look up the address lists that these rules are using for traffic policing:
~ # vsipioctl getaddrsets -f nic-1764245-eth0-vmware-sfw.2
addrset ip-securitygroup-12 {
}
addrset ip-securitygroup-13 {
}
addrset ip-securitygroup-14 {
}
addrset ip-securitygroup-15 {
}
addrset src1009 {
}
~ #