VCIX-NV Objective 5.4 – Troubleshoot Common Services Issues
This post is part of my VMware VCIX-NV Study Guide and covers some troubleshooting tips for common NSX services issues.
Documentation
Index
- Troubleshoot NSX Management Services issues
- Troubleshoot Service creation/deletion issues
- Troubleshoot Service Group creation/deletion issues
- Troubleshoot DHCP service issues
- Troubleshoot DNS service issues
- Troubleshoot Network Address Translation (NAT) service issues
- Troubleshoot Logical Load Balancer implementation issues
Troubleshoot NSX Management Services issues
If you’re having trouble with provisioning NSX services, it’d be wise to check the NSX Manager and it’s services. Login to your NSX Manager to check the status page:
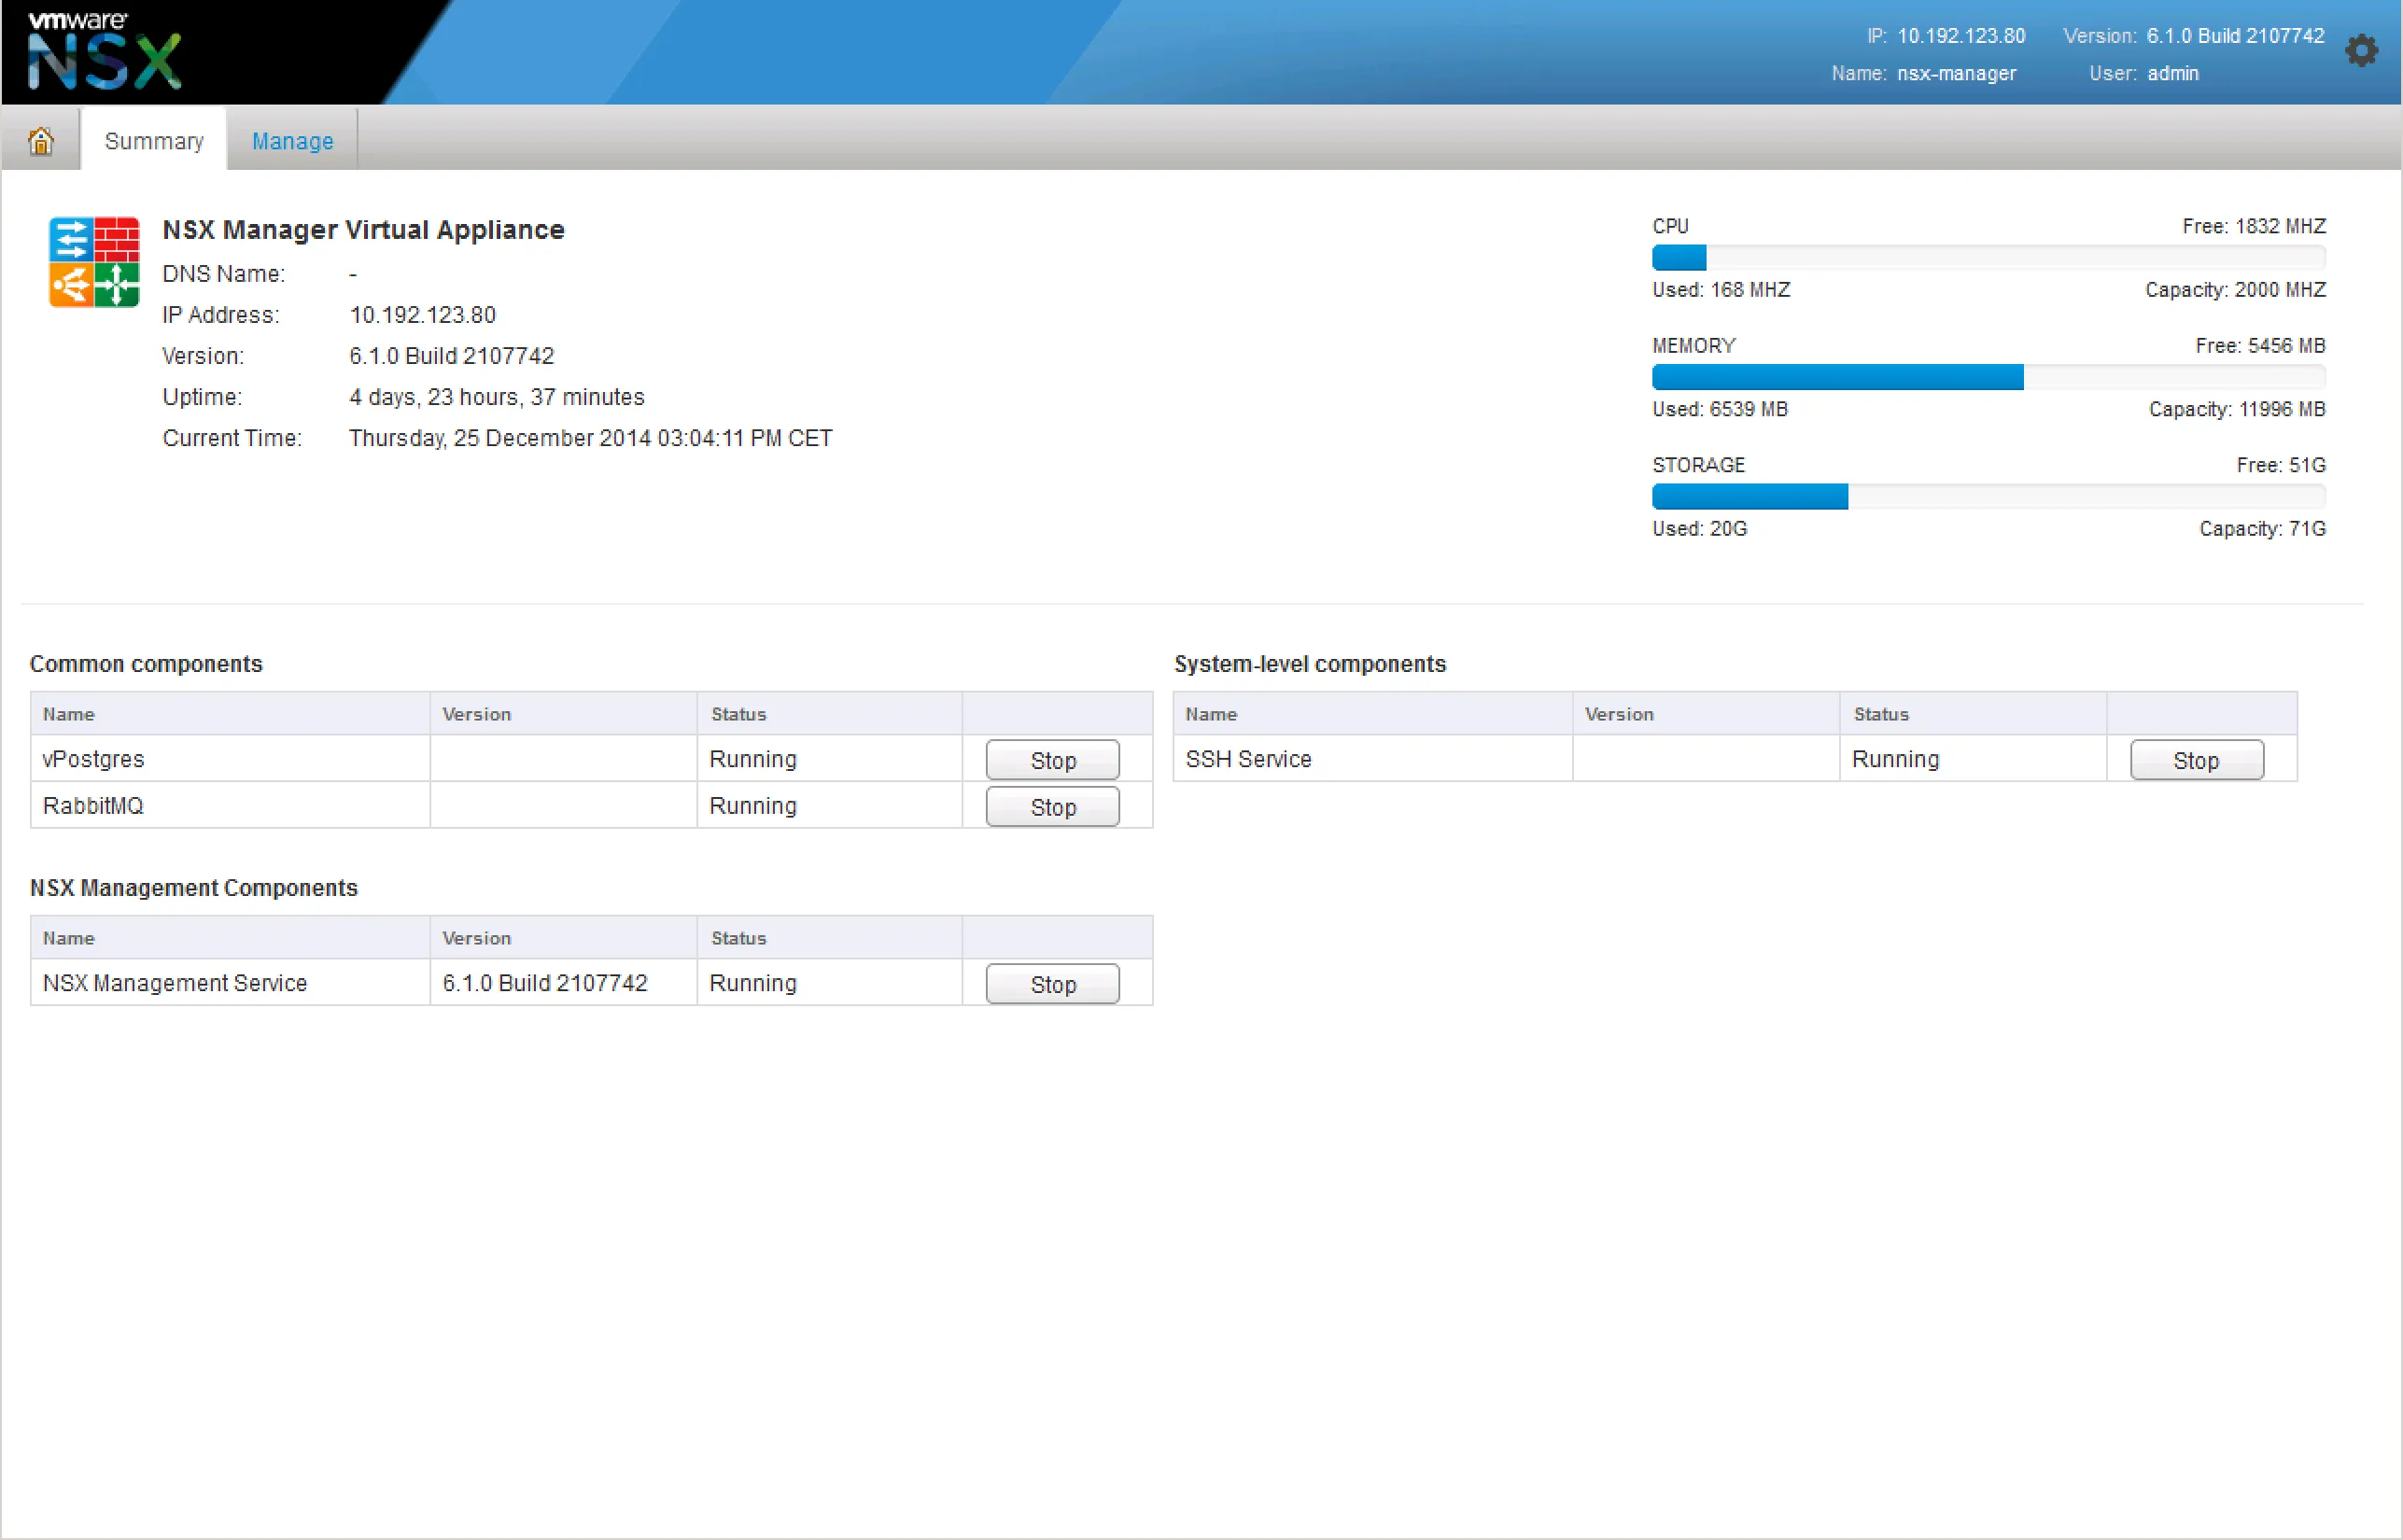
The vPostgres service is the database service. Without this, none of the configuration will be saved or even read. The API would give errors when retrieving or setting configuration, the control-plane would be generally unusable. The data-plane would be unaffected. The RabbitMQ service is an internal messaging service. The NSX Manager uses this to execute tasks, basically respond to certain UI interactions. If the RabbitMQ service is down, the most configuration will not be executed, even though it appears to be successful.
If that all looks good and the NSX Manager is still giving you issues, start the SSH service and login via SSH. There’s a few things you can check.
Check the filesystem usage: 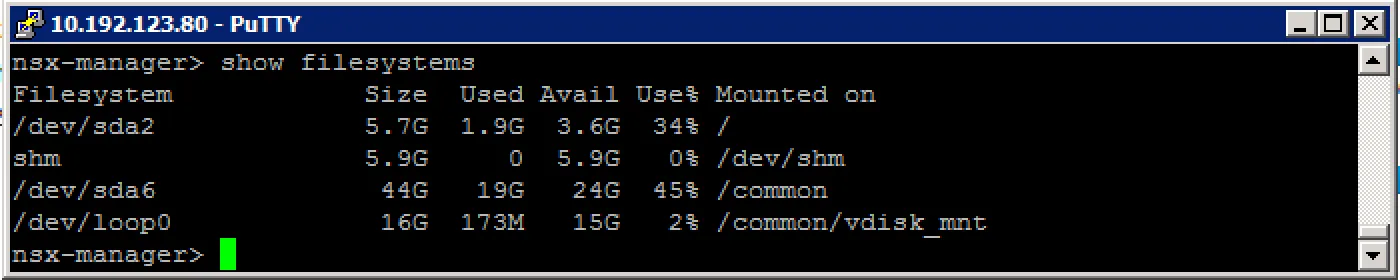
Check the event log: 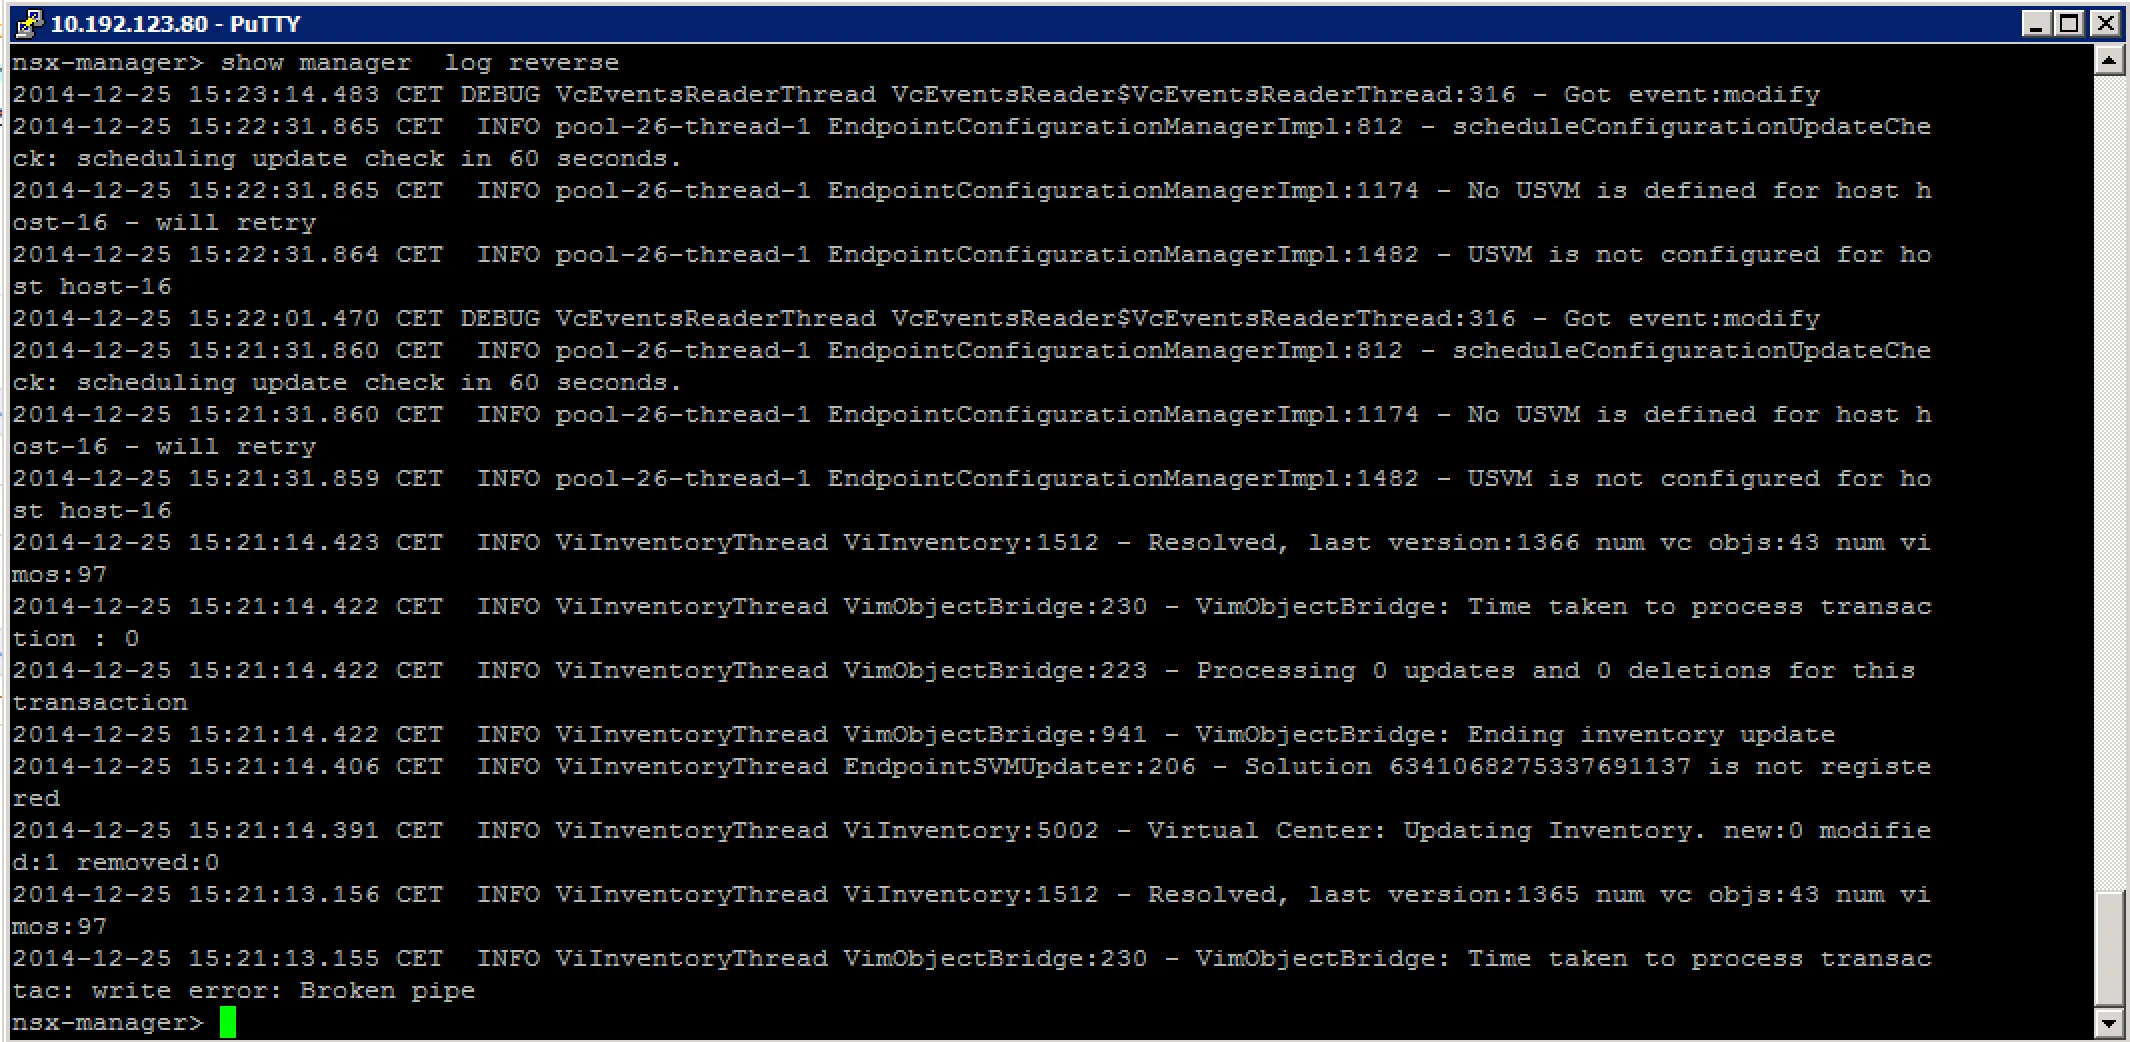
Check for rogue processes: 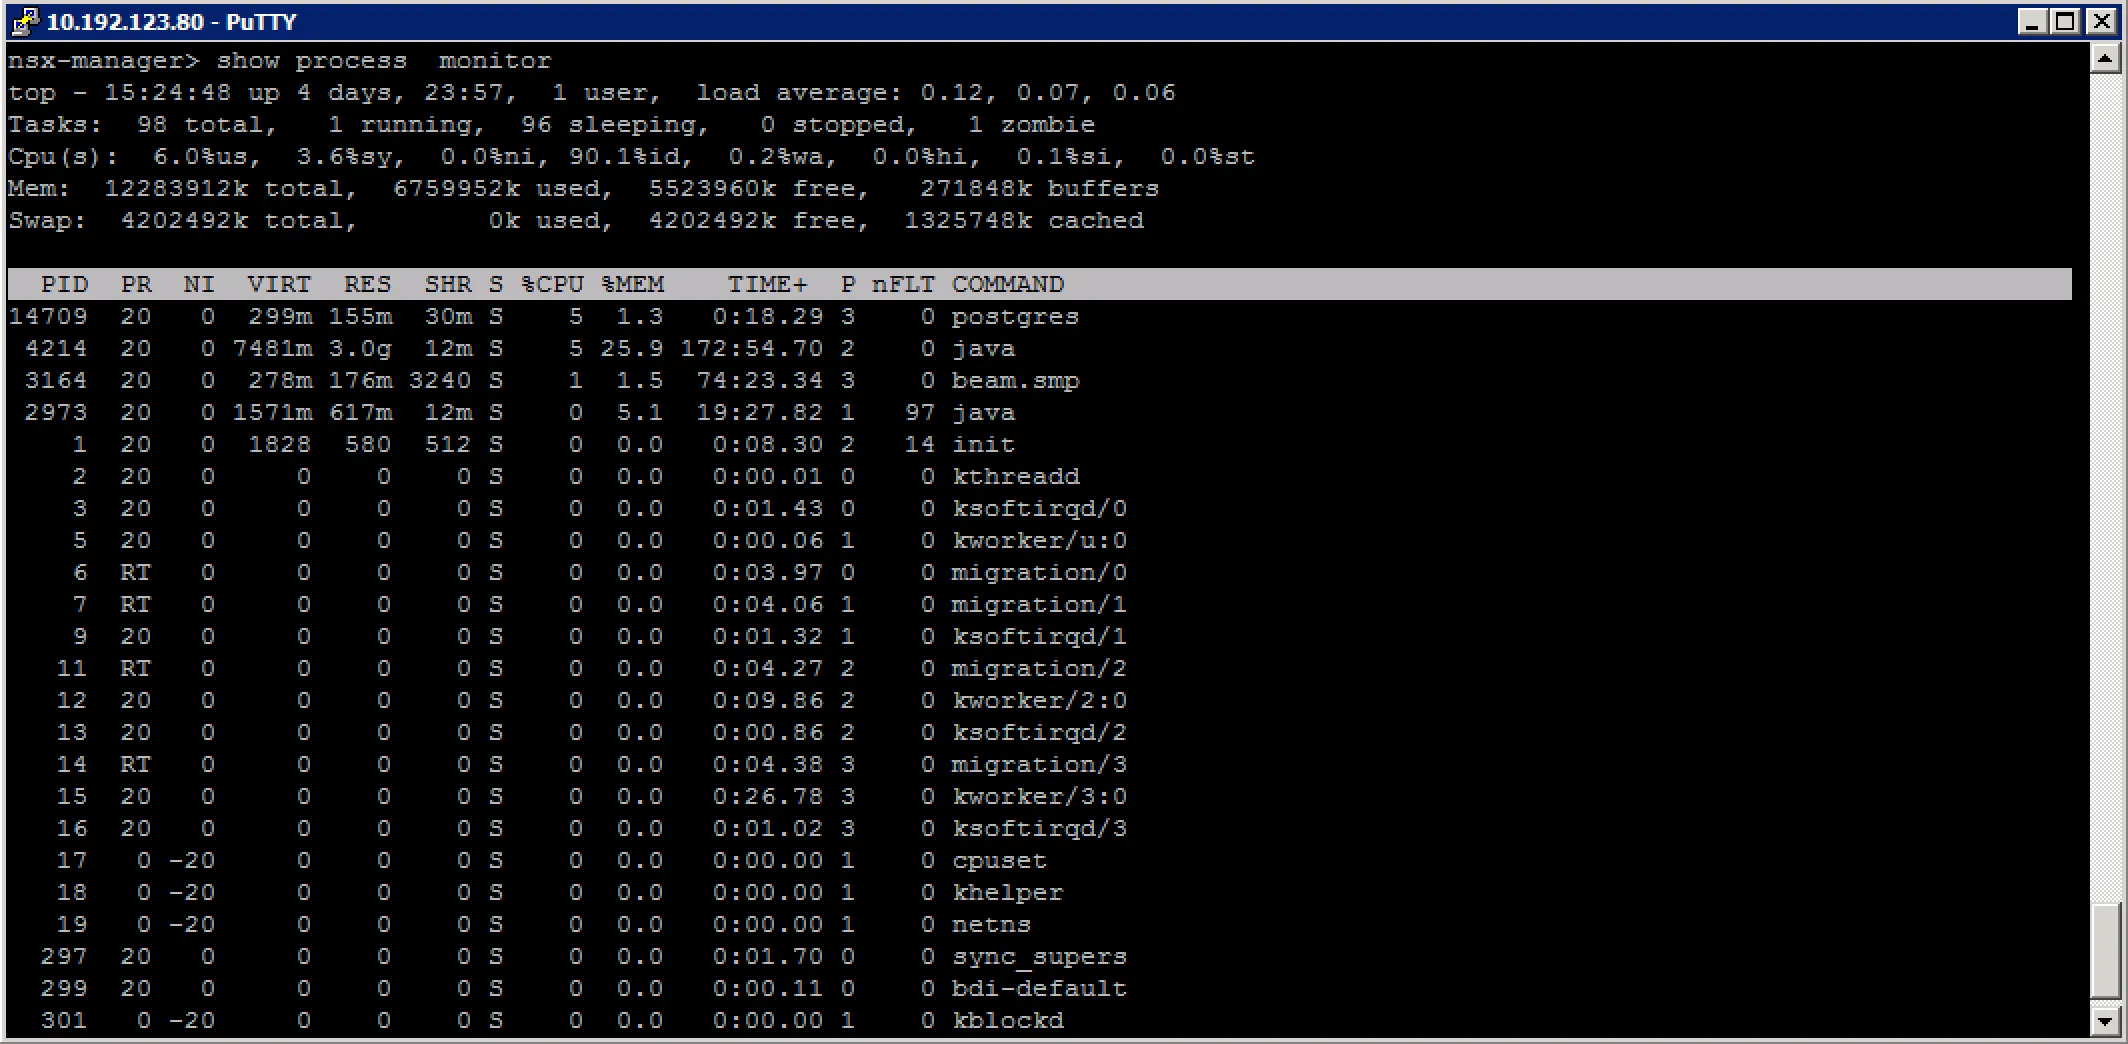
Troubleshoot Service creation/deletion issues
To be honest, I’m not so sure what they mean with this one. “Service creation” can mean a bunch of things, creation of a logical switch, a service composer service, creating a DHCP service pool, creating firewall rules, etc, etc. I’m going to skip this one because of that.
Troubleshoot Service Group creation/deletion issues
With creating a Security Group itself, there is not much that can go wrong. It is a logical entry in a database, which refers to other objects in the NSX space. There are a few things that can go wrong with the references to other objects though, I’ll go through some of those below.
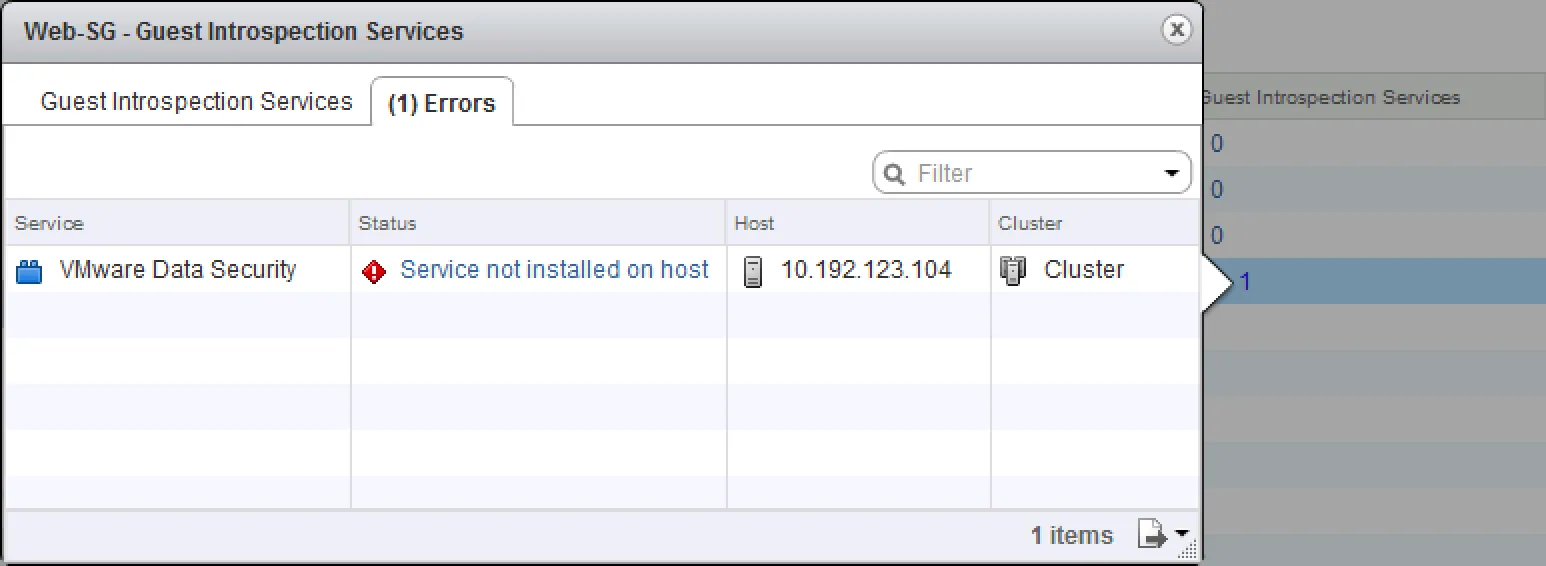
Introspection Services unavailable Selected services (Guest Introspection or Network Introspection) are not usable on the cluster which the virtual machines that are selected. When linking Security Policies to security groups, services can be put in the path of the network. You can even select services that are ultimately unavailable on the vSphere clusters:
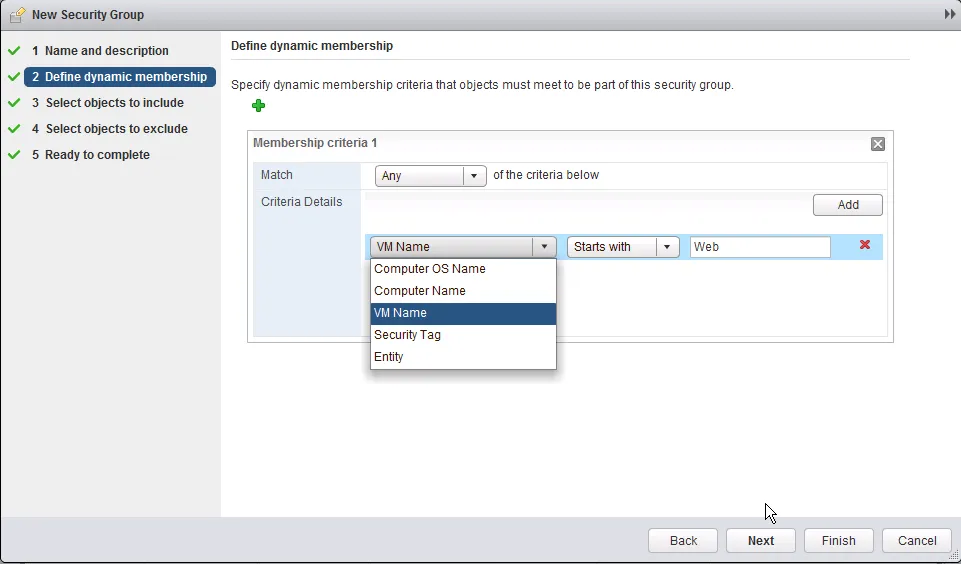
Virtual Machines not showing up There are three ways to include virtual machines in a Security Group: dynamic membership (based on machine criteria), static including and static excluding. Reasons for virtual machines not showing up in a security group are fairly simple: they do not match are of the dynamic membership criteria or they are statically excluded from the selection.
The dynamic membership can contain a lot of variable rules, which can complement or contradict each other in the same set of rules. Make sure you don’t make it overly complicated, keep it simple where ever you can.
Troubleshoot DHCP service issues
The NSX Edge Gateway Services can provide the virtual machines adjacent to its internal interfaces from IP addresses using DHCP. It can act as a DHCP service or DHCP relay. When you need to troubleshoot the DHCP service, first thing you do is check whether it is running. From the command line (login via SSH), execute this command:
vShield-edge-2-0> show service dhcp
-----------------------------------------------------------------------
vShield Edge DHCP Status:
Service dhcpd running (PID 20105).
Service dhcp relay not running.
From above output you can tell that the DHCP service (dhcpd) is running, but the DHCP relay service is not running. If you have a centralised DHCP server and your ESG just needs to relay DHCP requests to that server, you forgot to enable DHCP relay. ;-)
Moving on to the DHCP server service, specifically showing and clearing DHCP leases for virtual machines. To get an overview of all leases given out to virtual machines, execute this:
vShield-edge-2-0> show service dhcp leaseinfo
# The format of this file is documented in the dhcpd.leases(5) manual page.
# This lease file was written by isc-dhcp-4.2.5-P1

server-duid "\000\001\000\001\034M\026\326\000PV\203\355\374";

lease 192.168.1.200 {
  starts 6 2015/01/17 12:51:20;
  ends 0 2015/01/18 12:51:20;
  cltt 6 2015/01/17 12:51:20;
  binding state active;
  next binding state free;
  rewind binding state free;
  hardware ethernet 00:50:56:83:b3:df;
}

vShield-edge-2-0>
The output will be formatted in a pretty readable format. You’ve got a block of settings per lease that is given out. Starting with the IP address, you can also view the time the lease was given out, when it will be released and the mac address it is bound to.
You can manually release DHCP leases from the command line. I have not found a way to do so in the GUI, this seems the only way:
vShield-edge-2-0> enable
Password:
vShield-edge-2-0# clear service dhcp lease
vShield-edge-2-0# disable
vShield-edge-2-0> show service dhcp leaseinfo
# The format of this file is documented in the dhcpd.leases(5) manual page.
# This lease file was written by isc-dhcp-4.2.5-P1

server-duid "\000\001\000\001\034M\031\231\000PV\203\355\374";

vShield-edge-2-0>
The not-so-funny bit about this command is that you cannot choose which lease you want to clear. It is all or nothing, which can be a problem if you have a few VMs with DHCP and you’d like to keep those on the same IP address. Having said that, you should really enter manual DHCP bindings if that is a concern.
Troubleshoot DNS service issues
Virtual machines can also use the NSX Edge Gateway Services as their first hop DNS services. The ESG will forward their DNS requests to its own configured DNS servers and keeps a cache of requests so that it does not have to forward every request.
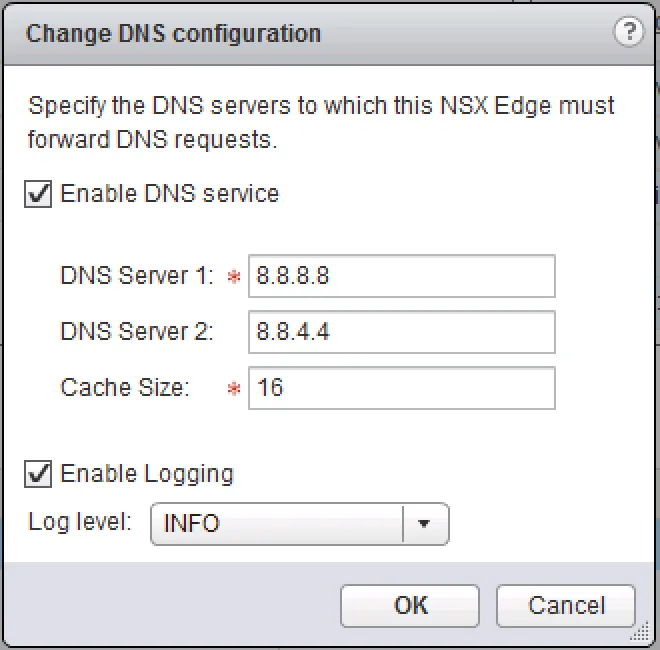
There are a few things to check when troubleshooting the DNS service. For starters, check whether the service has been configured correctly, with the proper DNS servers and that it is enabled.
Next, we’ll have a look at the service status and contents. To do this, first log into the ESG via SSH and execute and analyse the following commands:
vShield-edge-2-0> show service dns
-----------------------------------------------------------------------
vShield Edge DNS Server Status:
DNS is running (PID 12066).
Whoohoo, at least it’s running! Lets move on to the DNS cache:
vShield-edge-2-0> show service dns cache
;
; Start view vsm-default-view
;
;
; Cache dump of view 'vsm-default-view' (cache vsm-default-view)
;
$DATE 20150117123540
...snip...
; answer
113.66.194.173.in-addr.arpa. 3382 PTR   we-in-f113.1e100.net.
; answer
138.66.194.173.in-addr.arpa. 4455 PTR   we-in-f138.1e100.net.
; answer
google.nl.              219     A       74.125.133.94
...snip...
The cache contains a lot information, I’ve snipped it down a bit. The important things to notice is the “$DATE” value, which is the time the DNS record was cached and will be cleared.
If you’re having issues with the ESG returning wrong DNS records, you can clear the DNS cache manually by doing:
vShield-edge-2-0> enable
Password: *********
vShield-edge-2-0# clear service dns cache
vShield-edge-2-0# disable
vShield-edge-2-0> show service dns cache
;
; Start view vsm-default-view
;
;
; Cache dump of view 'vsm-default-view' (cache vsm-default-view)
;
$DATE 20150117124458
;
; Address database dump
;
;
; Unassociated entries
;
;
; Bad cache
;
;
vShield-edge-2-0>
Troubleshoot Network Address Translation (NAT) service issues
The first gold rule of troubleshooting NAT issues, is checking whether the firewall service is enabled. The NAT rules are injected to the firewall rules, as they are on a Linux server. The ESG is a linux-type appliance which works with the same firewall format as IPTables. If you’re used to CentOS, Redhat kind of Linux distros, the following troubleshooting command outputs will look very familiar to you. If you’re not one of those people, it’ll take some getting used to.
Alright, with that out of the way, lets dig in. To get an active overview of all NAT rules, you can execute the following command via command line:
vShield-edge-2-0> show nat
Chain PREROUTING (policy ACCEPT 0 packets, 0 bytes)
rid    pkts bytes target     prot opt in     out     source               destination
0         0     0 int_dnat   all  -- *      *       0.0.0.0/0            0.0.0.0/0
0         0     0 usr_dnat   all  -- *      *       0.0.0.0/0            0.0.0.0/0

Chain INPUT (policy ACCEPT 0 packets, 0 bytes)
rid    pkts bytes target     prot opt in     out     source               destination

Chain OUTPUT (policy ACCEPT 0 packets, 0 bytes)
rid    pkts bytes target     prot opt in     out     source               destination

Chain POSTROUTING (policy ACCEPT 0 packets, 0 bytes)
rid    pkts bytes target     prot opt in     out     source               destination
0         0     0 int_snat   all  -- *      *       0.0.0.0/0            0.0.0.0/0
0         0     0 usr_snat   all  -- *      *       0.0.0.0/0            0.0.0.0/0

Chain int_dnat (1 references)
rid    pkts bytes target     prot opt in     out     source               destination

Chain int_snat (1 references)
rid    pkts bytes target     prot opt in     out     source               destination
0         0     0 ACCEPT     all  -- *      *       0.0.0.0/0            0.0.0.0/0            policy match dir out pol ipsec mode tunnel

Chain usr_dnat (1 references)
rid    pkts bytes target     prot opt in     out     source               destination
0       234  1423 LOG        tcp  -- vNic_0 *       0.0.0.0/0            10.192.123.88        multiport dports 1234 LOG flags 0 level 4 prefix "DNAT_"
0       234  1423 DNAT       tcp  -- vNic_0 *       0.0.0.0/0            10.192.123.88        multiport dports 1234 to:192.168.1.200:1233

Chain usr_snat (1 references)
rid    pkts bytes target     prot opt in     out     source               destination
0         2     84 LOG        all  -- *      vNic_0  192.168.1.0/24       0.0.0.0/0            LOG flags 0 level 4 prefix "SNAT_"
0         2     84 SNAT       all  -- *      vNic_0  192.168.1.0/24       0.0.0.0/0            to:10.192.123.88
Now, this is an ESG with two NAT rules configured. A single source NAT and a single destination NAT rule. You’ll notice that those rules are placed under the ‘usr_dnat’ and ‘usr_snat’ chains. All NAT rules you configure yourself will be placed under those chains, all NAT rules that are configured by the ESG itself (when you are configuring other services and the ESG needs NAT rules to activate those) will be placed under the ‘int_dnat’ and ‘int_snat’ chains. All rules are on a first-come first-serve basis, so rules actually doing something (not the LOG rules) are processed from the top down.
Lets break it down a bit and focus on this one:
Chain usr_snat (1 references)
rid    pkts bytes target     prot opt in     out     source               destination
0         2     84 LOG        all  -- *      vNic_0  192.168.1.0/24       0.0.0.0/0            LOG flags 0 level 4 prefix "SNAT_"
0         2     84 SNAT       all  -- *      vNic_0  192.168.1.0/24       0.0.0.0/0            to:10.192.123.88
The “rid” field is a simple rule id, which is an internal ID as far as I can tell. The “pkts” and “bytes” fields are packet amount and size counters, you can see quickly spot whether the rule is getting any traffic. The “prot” field is the network protocol type (tcp, udp, ip, etc). The “out” field is the outgoing interface on which this rule is applied, this needs to be the interface that the traffic is leaving (or entering in destination NAT). The “source” and “destination” fields are the matching IP ranges on which the rule is triggered.
The last field is extra information on what the rule does. As you can see, the first rule only creates a log entry with a level 4 notification and prefixes the log entry with SNAT_. The second rule shows the IP address the source range is translated to. This can be the external interface IP address or a secondary IP address on the interface.
The destination NAT rules have pretty much the same fields and syntax, except for the extra information in the last field:
multiport dports 1234 LOG flags 0 level 4 prefix "DNAT_"
multiport dports 1234 to:192.168.1.200:1233
Destination NAT works in most cases as a port forwarding mechanism. The configuration used for a port forward is mentioned in the rules output. Of the output above, the first rule is another simple logging rule, logging to syslog with a level 4 and the message prefixed with DNAT_. The second rule contains the port mapping information. The first bit, multiport basically just means it can contain multiple destination ports. The second part “dports 1234” contains the actual destination (outside) ports and behind that is the translated inside IP address and port. When reading this right, you’ll see a translation of incoming port 1234 on vNic_0 that is translated to 192.168.1.200 to port 1233.
Troubleshoot Logical Load Balancer implementation issues
Below is an overview of commands you can use to troubleshoot load balancer issues. Seeing as load balancing is a broad subject, there is a lot of information you can grab from the Edge Services Gateway. I recommend using the command line for faster access to data and the fact that you can jump a bit more in detail.
vShield-edge-2-0> show service loadbalancer ?

  error    Show loadbalancer Latest Errors information.
  monitor  Show loadbalancer HealthMonitor information.
  pool     Show loadbalancer pool information.
  session  Show loadbalancer Session information.
  table    Show loadbalancer Sticky-Table information.
  virtual  Show loadbalancer virtualserver information.
show service loadbalancer error Show loadbalancer Latest Errors information. Show the latest errors that occurred on the load balancer service. Configuration errors, health check errors, session errors, name it. If you’re having a misbehaving load balancer, check this first.
show service loadbalancer monitor Checks the load balancer health monitor status. See if every service that is configured is healthy or is partly down.
show service loadbalancer pool Retrieves load balancer pool information.
show service loadbalancer session Shows all active network sessions to the configured load balancer services. Handy to tell if any services are overloaded, or if they are even receiving traffic at all.
show service loadbalancer table Shows the current sticky connection table. If services are configured with a sticky setting on them, recurring connections from the same origin will be redirected to the same server. This table lists the mappings between connections and servers.
show service loadbalancer virtual The virtual server is where the connections come in. This will show the configured virtual servers and current active information about those virtual servers.