
Besides monitoring Windows Services and the vCenter Server Appliance, you can also use vRealize Operations to monitor custom data through OS scripts. Attached to an Operating System object, an OS Script can output the health status and/or a metric for use in analysis. I will dive into the health status part for this post.
Setting the Stage
In this article, I’ll be using an example with a Linux server and the open source storage product Gluster. The OS Script will be checking whether a Gluster volume is healthy and allows vROps to generate alerts when something goes wrong with the Gluster volume. Before we continue, the rest of this article assumes there is an existing End-Point Operations Agent installed on the Linux server.
The OS Monitor Script
Gluster is a storage replication service which can serve as a redundant storage system. It does this by replicating block volumes between servers, or as Gluster calls them; bricks. To determine if the service is healthy; a volume needs to be “started” and the amount of bricks needs to be equal to the amount of servers you’re replicating between. Here’s the script I’ll be using for the health status:
Basically this checks whether a specific volume is running and if the amount of servers is what you’d expect it to be. The exit code is the bit that determines the health for vROps. Zero (0) means healthy and one (1) means broken.
Adding the OS Script
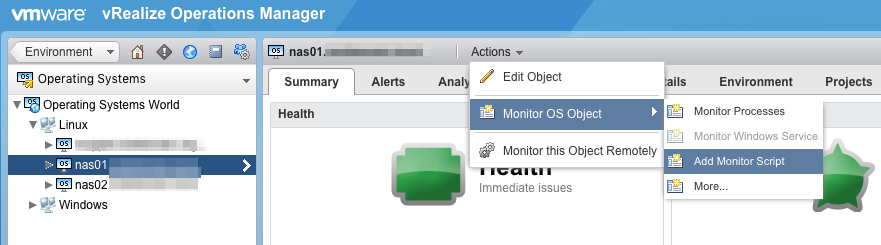
After putting the script on the server and adding the server to vROps, navigate to the server and use the Actions > Monitor OS Object > Add Monitor Script menu to enter the details of the scripts location and parameters it needs.
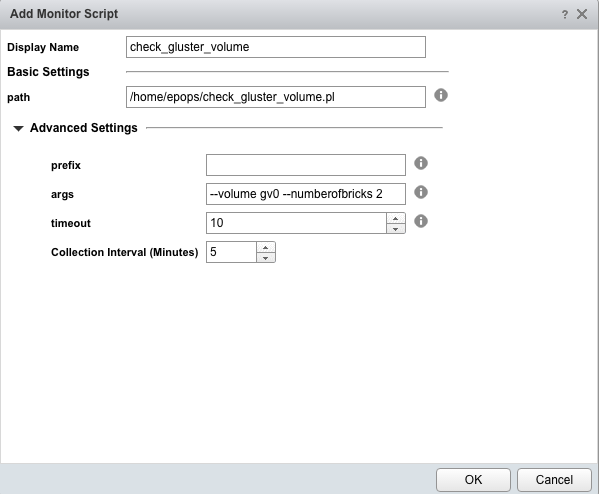
Here are the settings that you can use:
- Display Name: A friendly name for the check
- Path: The full path to the script on the server.
- Prefix: Any string before the script path (like /usr/bin/perl)
- Args: Parameters to give to the script. In this case the Gluster volume name and the number of servers in the cluster.
- Timeout: Amount of seconds to wait for the execution before timing out.
- Collection Interval: How often you want to monitor this.
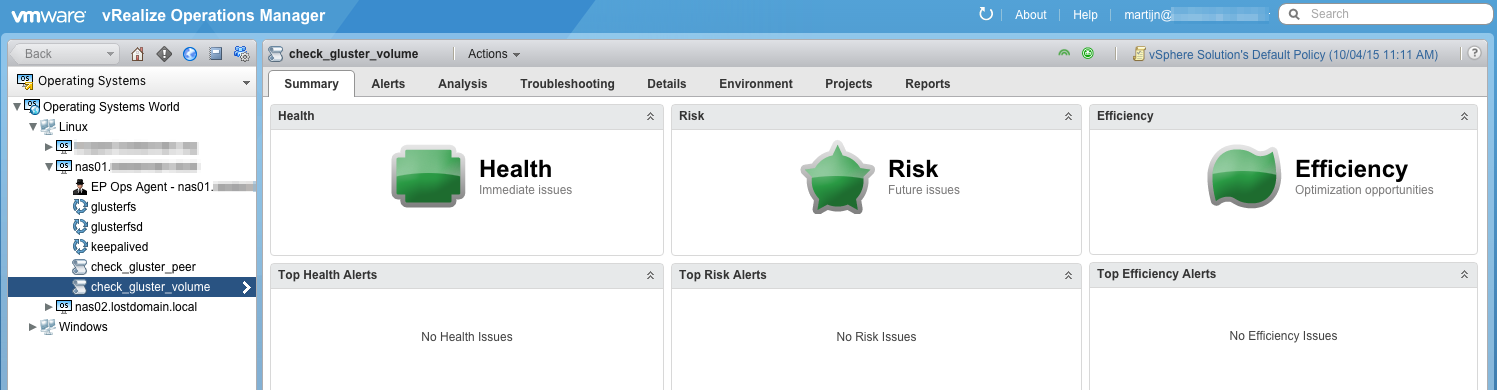
After adding the Monitor Script, it will start collecting via the End-Point Operations Agent and it will be visible under the server in the Operating Systems World. The health status can now be used for notifications and can be put in a dashboard for easy access.
So that’s how you add a monitor inside vRealize Operations that executes a script to determine the health status of a service. Next time I’ll cover integrating metrics into OS scripts.
Leave a Reply