Integrating vRealize Network Insight and Log Insight
Starting in version 3.8 of Network Insight, you can integrate vRealize Log Insight with Network Insight in order to get faster changes in the NSX environment.
Polling vs real-time data
Currently, the collector of Network Insight polls NSX every 10 minutes for changes in the entities (security groups, tags, firewall rules, etc). It will also back off when the NSX Manager has too much load, extending the polling period and give the NSX Manager some breathing room. While this is generally okay for troubleshooting scenarios, it should be improved significantly for monitoring purposes where you need real-time data.
Syslog
This is where syslog comes in, as you can’t get real-time information when polling data sources, the data needs to come to you. NSX has multiple ways of logging information, including everything that happens on the NSX Manager, Controllers, Edges and hypervisor hosts. Whenever something happens inside NSX (configurational or operational change), it will send out real-time data for analysis. Network Insight is leveraging that system to get real-time data around configuration changes.
Currently, the only change it monitors are the NSX Security Groups. Whenever a VM enters or leaves a Security Group, Network Insight will instantly process that change. Instead of creating an entirely new syslog server inside Network Insight, it’s leveraging the existing syslog server; vRealize Log Insight.
Workflow
Below is a representation of how the workflow from NSX to Network Insight via Log Insight works.

Prerequisites
Before we begin, here’s what we need first:
- vRealize Network Insight 3.8+
- vRealize Log Insight 4.5+
- NSX 6.2+ (logging towards Log Insight)
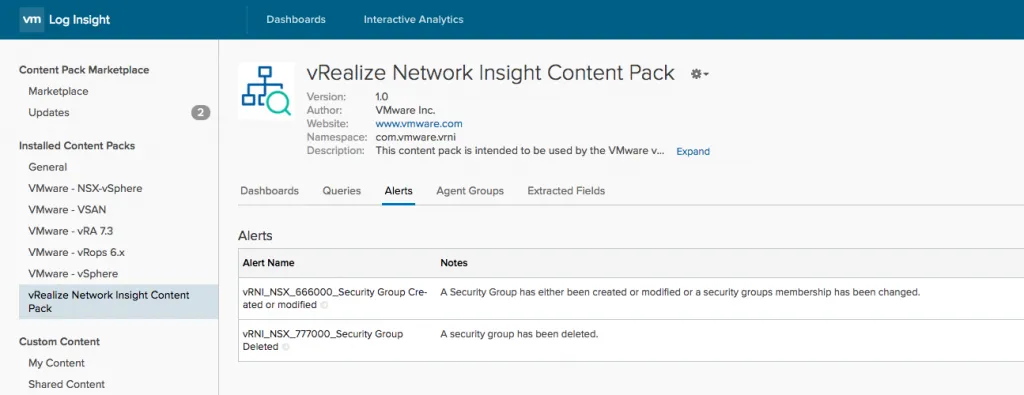
- Installed the vRealize Network Insight Content Pack in Log Insight. (Menu -> Content Packs -> Marketplace -> Install the Network Insight content pack)
The content pack does not have a lot of content, the primary reason for needing this is the alerts it sets up for you.
Adding Log Insight as a Data Source
You can now add Log Insight as a data source in Network Insight. Do this by going to Settings -> Accounts and Data Sources -> Add Source -> Log Insight. You’ll be presented with a form that you need to fill out with your Log Insight details. Below is an example:
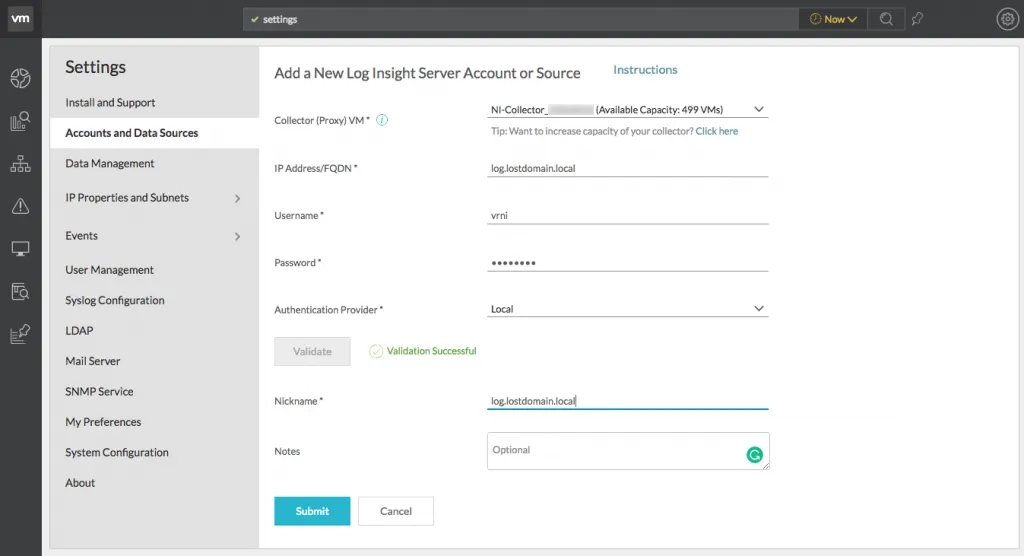
- Select the collector you want to use to receive incoming webhooks from Log Insight
- Provide the username and password used to connect to and validate Log Insight.
- Note: the credentials given do not have to have administrator permissions, a regular user is fine. All this does is validate the Log Insight version
- Select the Authentication Provider; this can be vIDM, AD or the built-in authentication
- Click the Validate button to validate the Log Insight instance
- If all goes well, give it a nickname and press the Submit button
Adding the Webhook to Log Insight
After pressing the submit button and adding the Log Insight instance as a data source, you’ll get this popup:
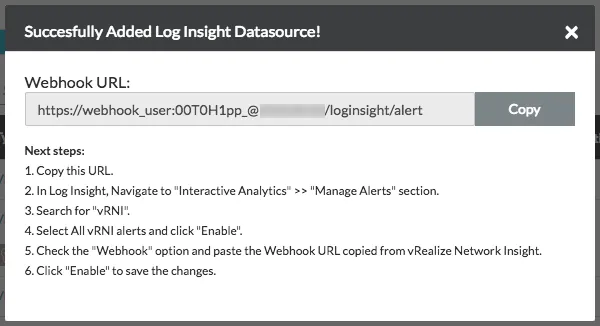
What this basically says is that you need to modify the webhook inside Log Insight so that it points to the Network Insight collector you’ve chosen to handle the alerts. It would be nicer if Network Insight used the Log Insight APIs to do this, but hopefully, it will be automated in the future. You can also see that there’s been a user created that will be used to authenticate
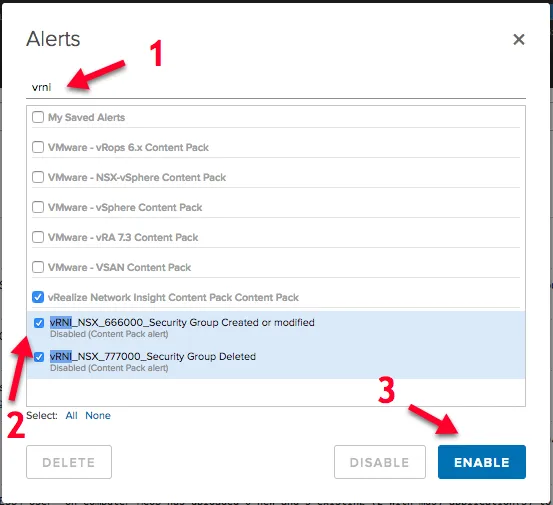
Now do exactly as it says, browse to Interactive Analytics -> Manage Alerts
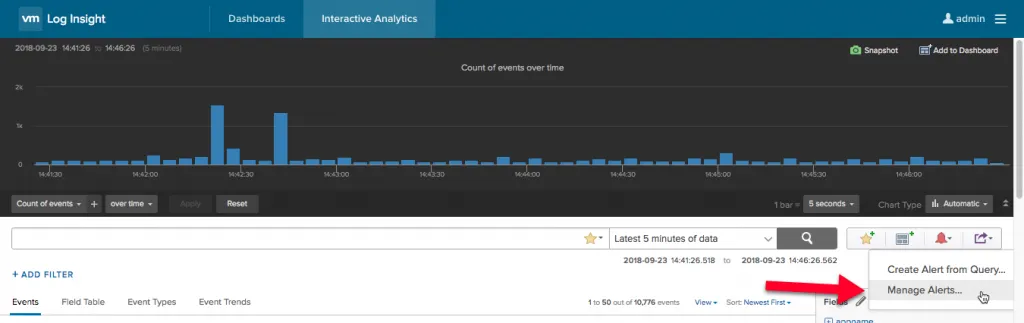
In the popup that comes appears, search for vRNI, select the 2 alerts created by the Network Insight Content Pack and click the Enable button.
Another pop-up appears in which you can disable the Email alert and enable the Webhook alert. Paste the URL from Network Insight there.
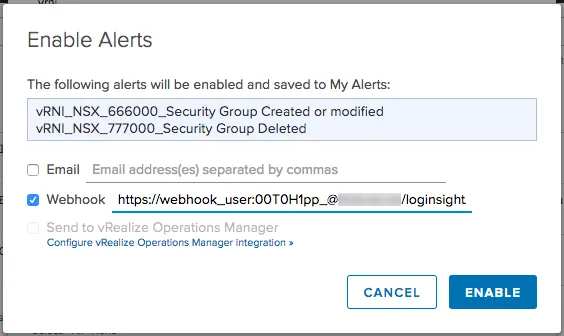
This will create copies of the alerts that come with the Content Pack and will put them under My Saved Alerts, in case you go looking for them later.
You’re done!
That’s it. Log Insight will now look for Security Group updates and send them directly to Network Insight for processing.