You can create some pretty cool and quick dashboards with vRealize Log Insight. Send it some data, set some filters, and create widgets that represent the data in a good way.
I just finished creating some good usage dashboards for the vRealize Network Insight Field Demo instances we have. The NGINX logs are sent via the log insight agent to vRLI, and then I filter out the unique visitors, popular searches, pinboards, and more. I wanted to see how often the field demo gets used and what’s being used.
The only problem is that vRLI doesn’t support generating scheduled reports, and I wanted a weekly report on that usage.
Browser Automation with Python
Enter Selenium, a Python module that can automate browser actions. Typically used for website testing in pipelines, it can do all kinds of cool things. Like input form details, click buttons, and take a screenshot of a page.
I used those exact actions to log into vRLI, load the dashboard I’m interested in (with the right time window), and then take a screenshot for the report. You can find the script here:
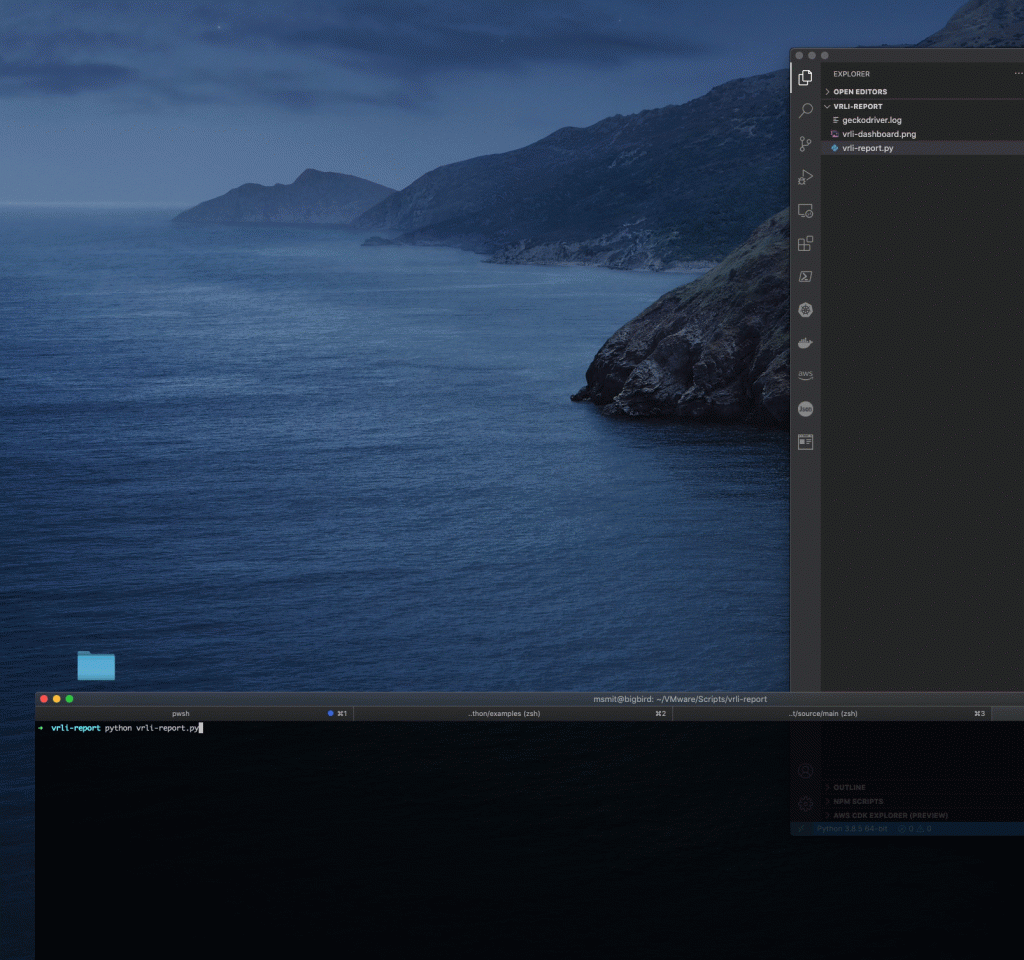
By default, this script will run headless (so no desktop needed) and can be run on a server. The set_headless() function makes that possible. It was a lot of fun developing this, without the headless option set. Remove the option and run it on your desktop to see this magic:
Post Processing
The end result of the script is a screenshot of the dashboard content. I didn’t include the post-processing that I’m doing in my version, mostly because it can be wildly different from what you could use this for.
You could take the screenshot and email or store it somewhere, or go even further (like me) and parse the HTML that’s returned from the dashboard. For example, I’m picking out the number of HTTP requests and unique visitors, and putting that on Slack every week.
If you use this, please let me know what for! 🙂


Leave a Reply