Tunneling Plugwise Smile P1 Stats to Grafana
Hi! It’s been a while. I’m going to (re)start sharing solutions to problems that I’m building things for. Expect posts mostly around coding and IoT. Starting with this post; a quick tutorial on how to get power statistics from a Plugwise Smile P1 gateway to Grafana, using Telegraf.
I’ve got solar panels with Enphase inverters with central management, which has an API. Its been streaming power generation stats to Grafana using this solution, for a while. Recently, I added a Plugwise Smile P1 gateway to monitor the smart meter and I wanted to get its power stats into Grafana as well. Charting power generation and consumption next to each other. 😊
There wasn’t a good solution that I could find on the interwebs, so I wrote a small script that does the trick. Luckily, the Smile P1 has an API that has everything you could want.
First, I’m going to assume you have a working Grafana instance, a device like a Raspberry Pi (or another server-like device), and have Telegraf and Python installed on said device.
Smile P1 Script
We can piggy-back on a python script that was created as a Home Assistant module. Grab a copy here., and place it on your device. Even though that repository says it’s archived and there’s a newer version - this script will do just fine. Also grab the requirements.txt, for easy dependency installation.
Install the dependencies using this command:
pip install -r requirements.txtAfter the dependencies are in place, copy this script onto your device and name it smile-p1-energy-readout.py:
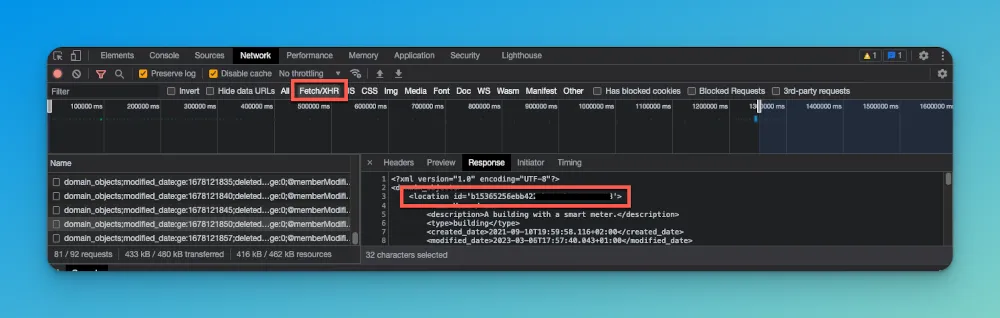
You need to update 3 values in the script; the IP address and gateway password between Smile(), and the location-id. You can get the location ID by going to the Smile gateway via your browser and inspecting the network calls. Specifically, when searching for Fetch/XHR calls, you will see calls to /core/domain_objects. Open the details of one of those requests and you will see this:
Test the Script
Once you have those 3 values in place, run the script to make sure it works:
martijn@pi-hole-secondary:~ $ python smile-p1-energy-readout.py{"net_electricity_point": 590.0, "electricity_consumed_peak_point": 590.0, "electricity_consumed_off_peak_point": 0.0, "net_electricity_cumulative": 15749011.0, "electricity_consumed_peak_cumulative": 9415514.0, "electricity_consumed_off_peak_cumulative": 13460157.0, "net_electricity_interval": 10.0, "electricity_consumed_peak_interval": 10.0, "electricity_consumed_off_peak_interval": 0.0, "electricity_produced_peak_point": 0.0, "electricity_produced_off_peak_point": 0.0, "electricity_produced_peak_cumulative": 4845524.0, "electricity_produced_off_peak_cumulative": 2281136.0, "electricity_produced_peak_interval": 0.0, "electricity_produced_off_peak_interval": 0.0, "gas_consumed_cumulative": 3585.88, "gas_consumed_interval": 0.02}If it outputs JSON where you can recognise power values, success! If something goes wrong (i.e, wrong password or location ID), it’ll also tell you.
Telegraf Config
Now the script is running successfully and you’re getting output from your smart meter, we can add this simple configuration to Telegraf and have it start sending data to Grafana via InfluxDB.
[[inputs.exec]]commands = [ "python /home/martijn/smile-p1-energy-readout.py"]timeout = "60s"interval = "30s"data_format = "json"json_strict = trueGrafana
Once Telegraf starts collecting, you’ll have access to all of the datapoints that are in the JSON output above, and you can start creating panels in Grafana to showcase them. I don’t have a full dashboard export that you can easily import, but here’s an example of an energy usage chart that shows the progressing of my grid consumption:
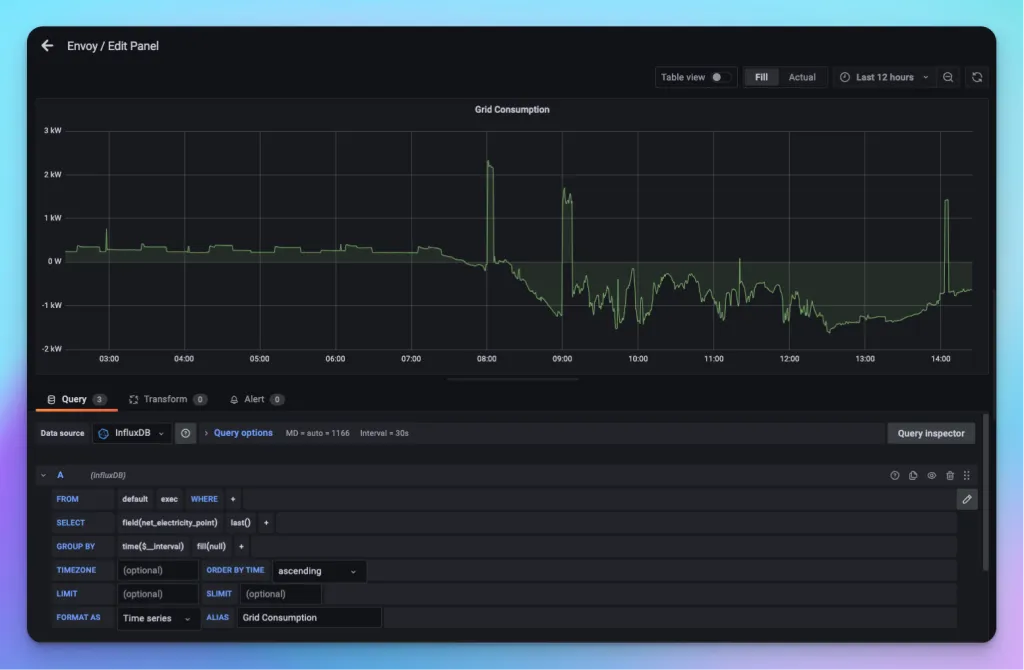
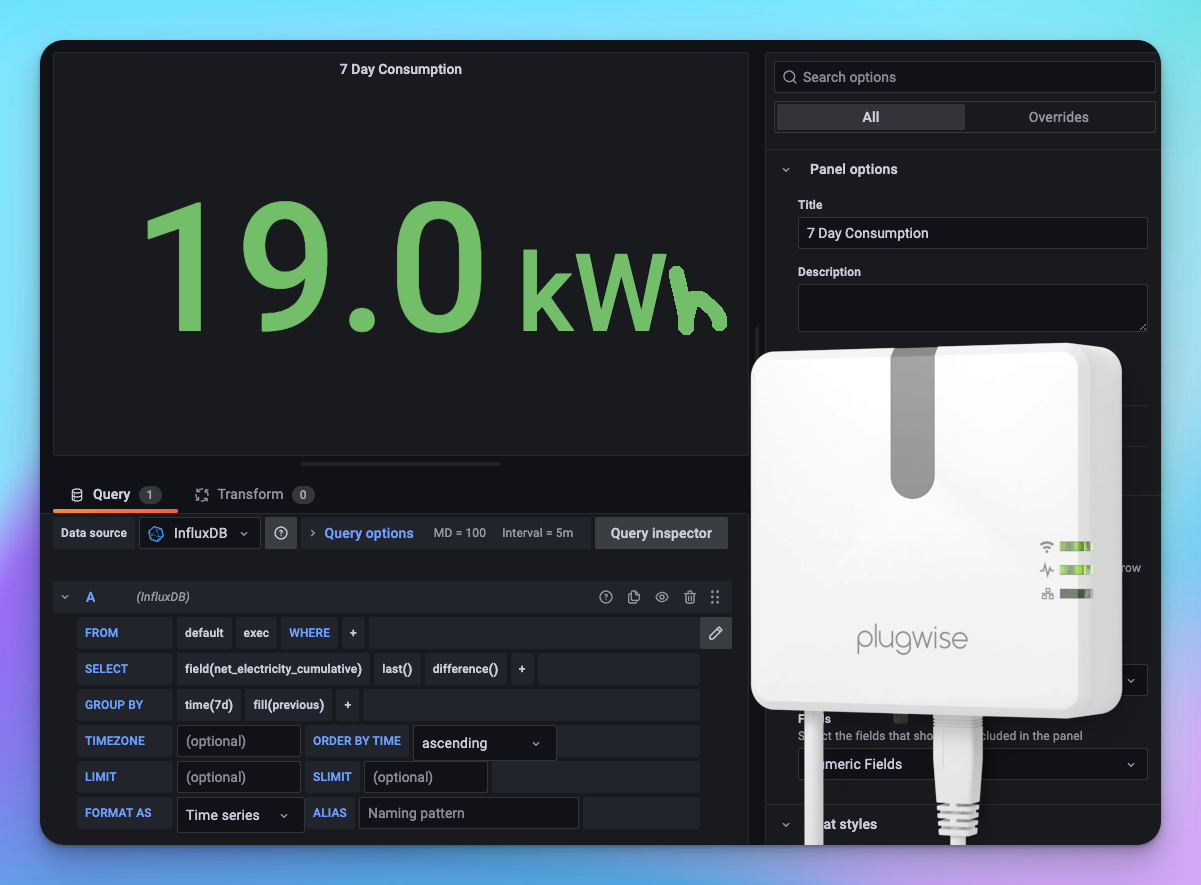
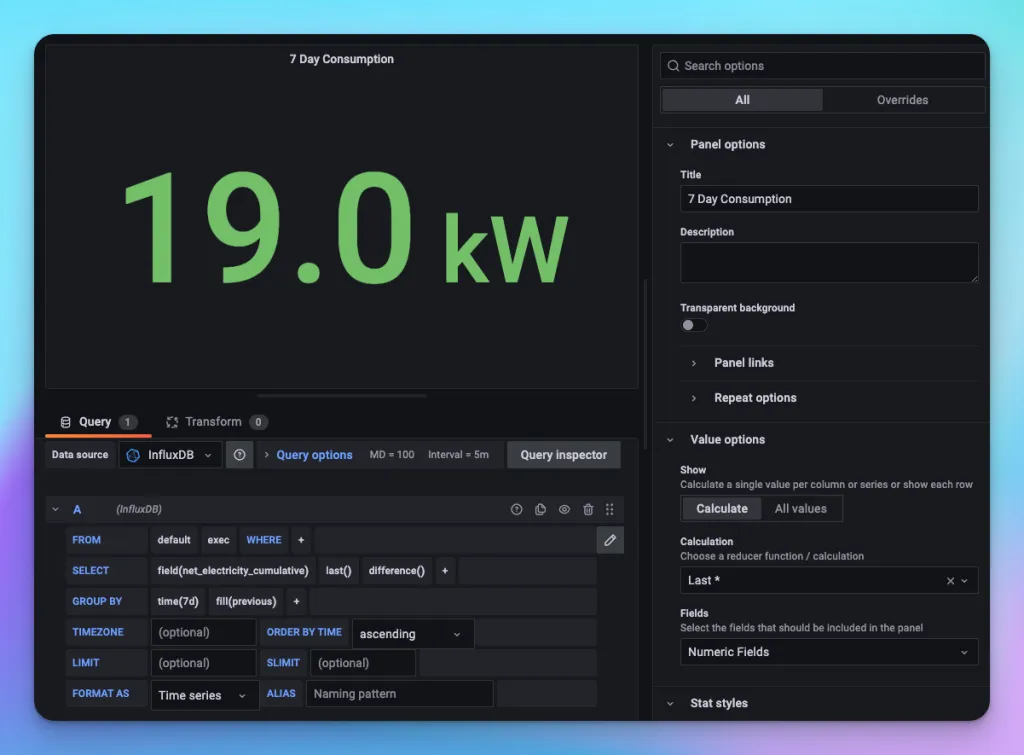
This is using the net_electricity_point datapoint. My last example shows the grid consumption over the last 7 days, using the net_electricity_cumulative datapoint, which Grafana calculates the difference over in the week:
Hope this was useful!